[Gauntlet] Weekly Market Update - (2025-06-09 through 2025-06-15)
Base
Gauntlet would like to provide the community with an update on this market over the previous week. Gauntlet is continuing to monitor this market.
Summary
This table gives high-level statistics over the time frame in question. Bold lines correspond to weekly average supply/borrow cap usage over 75%.
| Asset | Current Borrow Cap | Current Supply Cap | Average Borrow Cap Usage (Past Week) | Average Supply Cap Usage (Past Week) | Average Utilization | Current DEX 25% Slippage (USD) |
|---|---|---|---|---|---|---|
| USDC | 184.00M | 200.00M | 49.23% | 50.33% | 89.99% | $546.20K |
| WELL | 75.00M | 150.00M | 28.82% | 65.00% | 22.17% | $2.04M |
| AERO | 25.00M | 70.00M | 32.70% | 37.74% | 30.95% | $11.09M |
| EURC | 21.00M | 21.90M | 13.33% | 18.52% | 69.00% | $669.11K |
| VIRTUAL | 2.30M | 4.50M | 34.16% | 29.53% | 59.12% | $5.02M |
| MORPHO | 1.00M | 4.00M | 50.48% | 58.89% | 21.43% | $258.33K |
| USDS | 690.00K | 750.00K | 1.28% | 1.50% | 78.44% | $85.12K |
| DAI | 300.00K | 400.00K | 6.14% | 8.08% | 57.02% | $125.56K |
| WETH | 64.00K | 96.00K | 39.18% | 31.17% | 83.81% | $27.61M |
| cbETH | 6.40K | 16.00K | 1.14% | 17.13% | 2.66% | $2.13M |
| wstETH | 4.80K | 14.40K | 3.99% | 30.72% | 4.33% | $384.02K |
| rETH | 900.00 | 2.60K | 2.72% | 49.90% | 1.89% | $2.73M |
| weETH | 700.00 | 4.00K | 4.95% | 49.94% | 1.74% | $1.66M |
| cbBTC | 640.00 | 1.50K | 17.24% | 46.43% | 15.85% | $14.69M |
| wrsETH | 430.00 | 1.00K | 0.26% | 28.66% | 0.38% | $33.03K |
| LBTC | 38.00 | 95.00 | 25.64% | 47.55% | 21.57% | $65.72K |
| tBTC | 36.00 | 90.00 | 9.95% | 15.22% | 26.14% | $1.11M |
| USDbC | 1.00 | 1.00 | 155.24K% | 1.43M% | 10.82% | $825.19K |
Top Movers
- EURC’s borrow balance increased WoW by 45% from $3M to $4M.
- wrsETH’s borrow balance decreased WoW by 66% from $4K to $1K.
- AERO’s supply balance increased WoW by 44% from $14M to $20M.
- tBTC’s supply balance decreased WoW by 22% from $2M to $1M.
- EURC’s utilization increased WoW by 35% from 55% to 73%.
- wrsETH’s utilization decreased WoW by 66% from 1% to 0%.
Liquidations
| Liquidated Asset | Liquidated Amount (Tokens) | Liquidated Amount (USD) |
|---|---|---|
| mUSDC | 518.46K | $518.33K |
| mcbBTC | 0.69 | $71.69K |
| mAERO | 40.34K | $25.36K |
| mWELL | 337.43K | $10.14K |
| mLBTC | 0.03 | $3.21K |
| mtBTC | 0.01 | $1.05K |
| mWETH | 0.12 | $313.83 |
| mVIRTUAL | 74.42 | $141.90 |
| mwstETH | 0.04 | $116.87 |
| mEURC | 24.47 | $27.93 |
| mweETH | 0.00 | $4.60 |
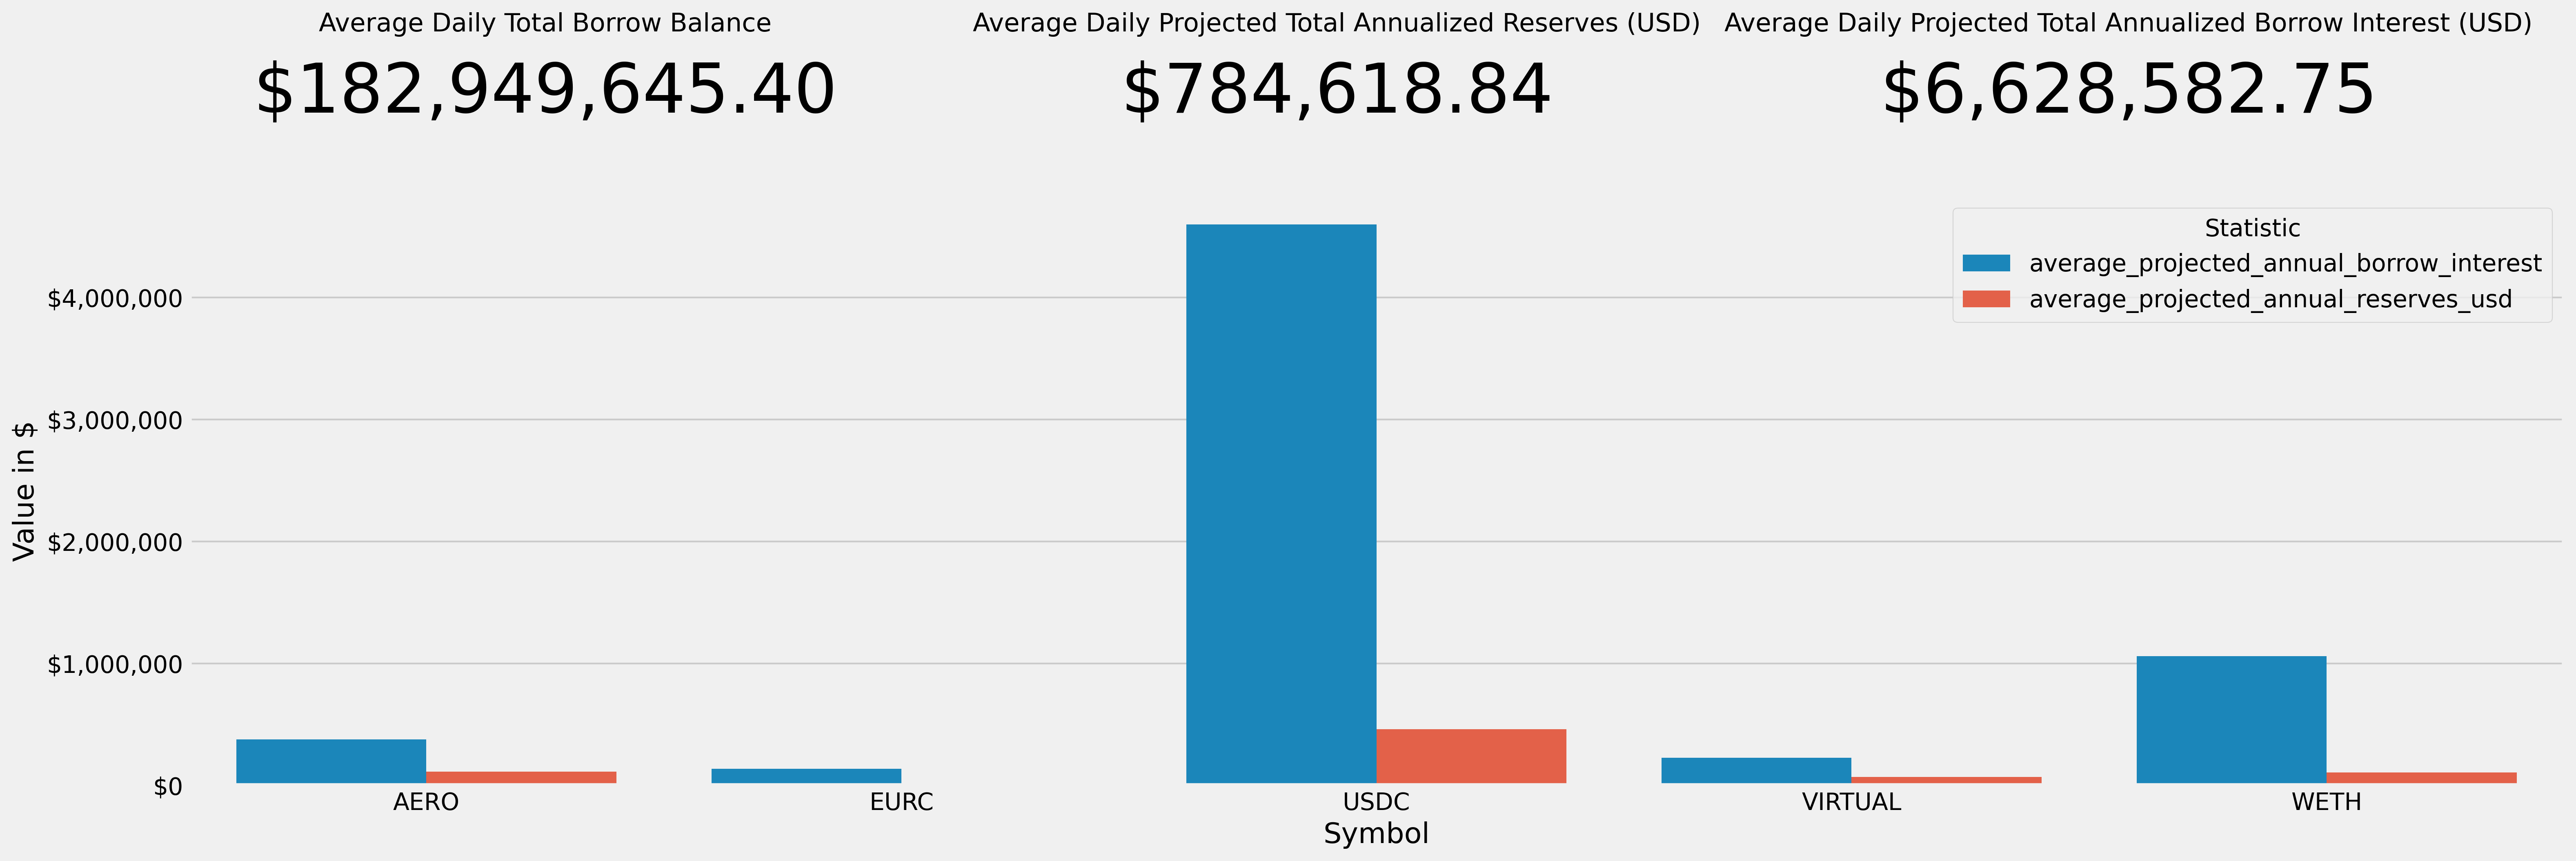
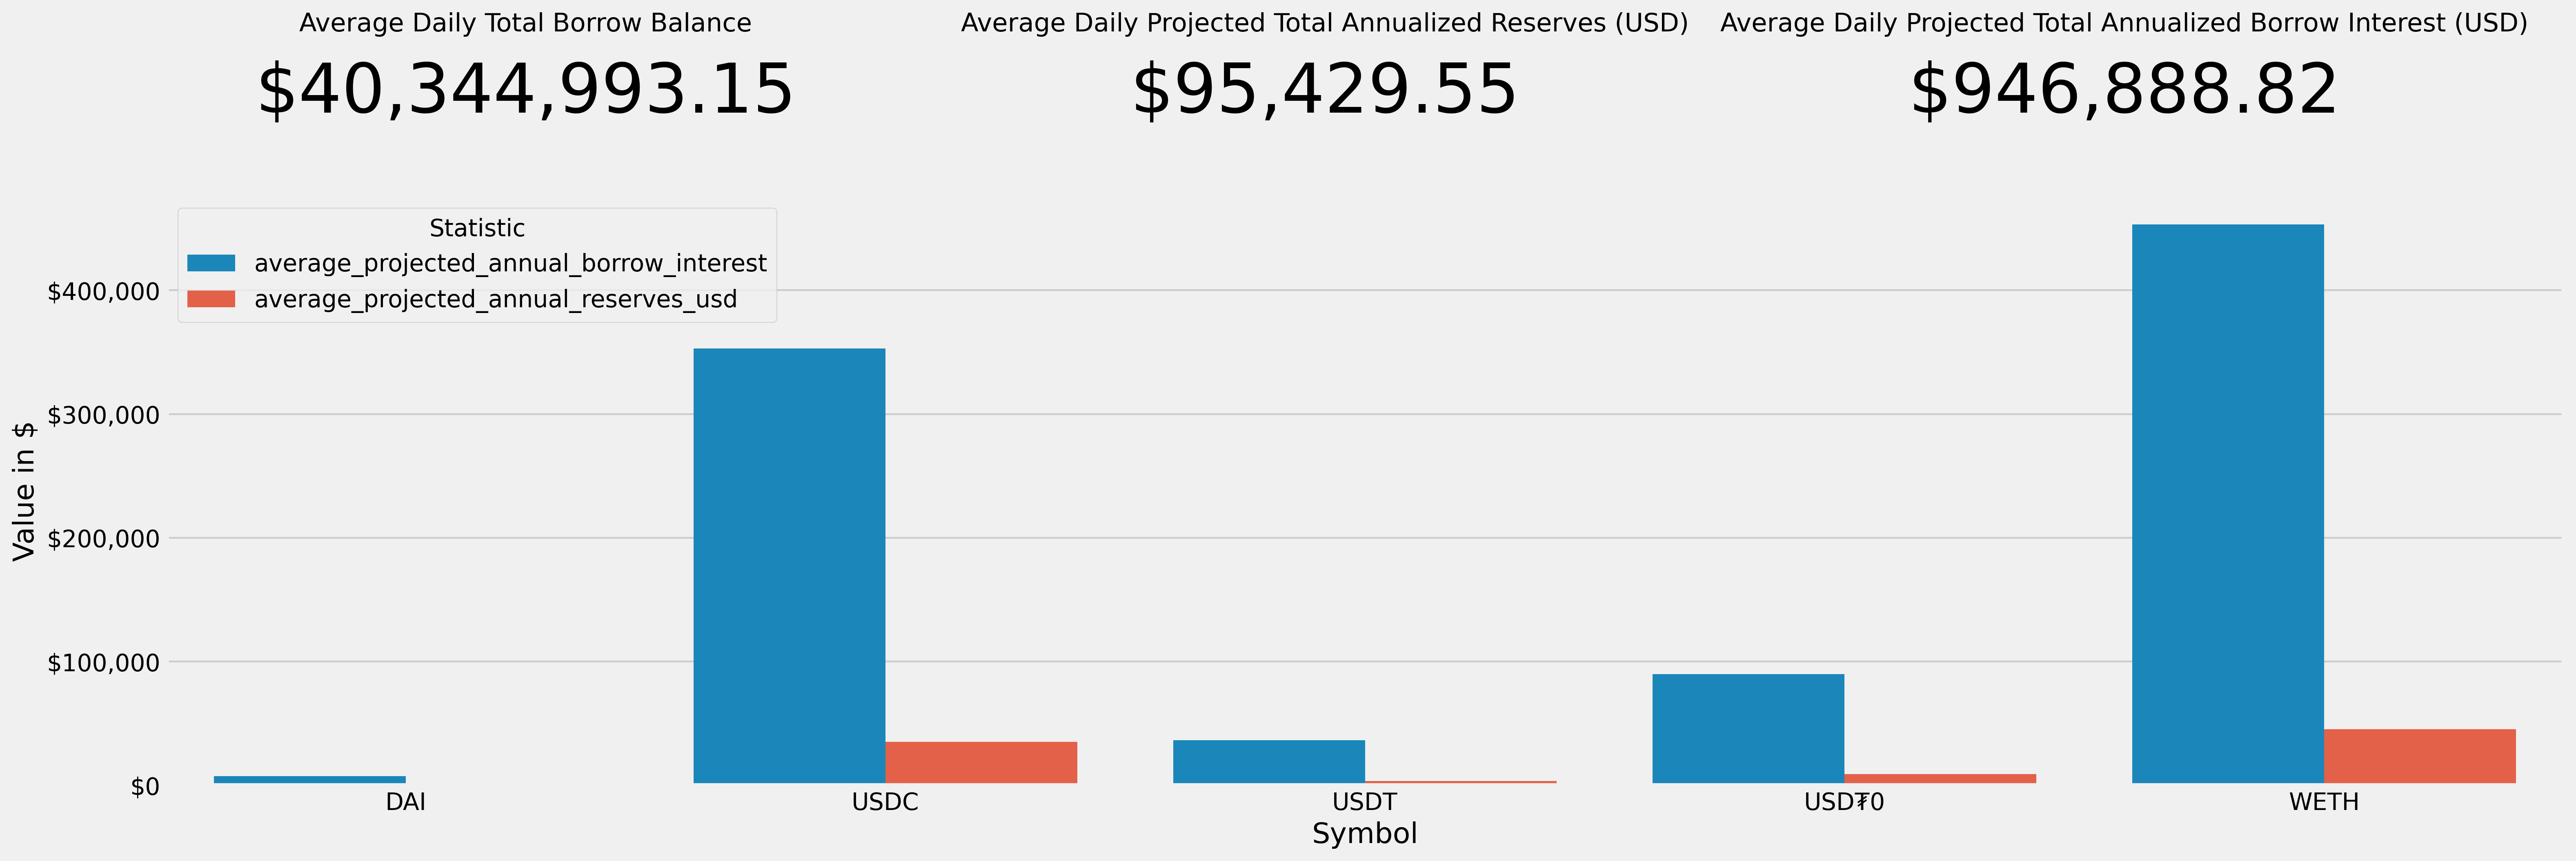
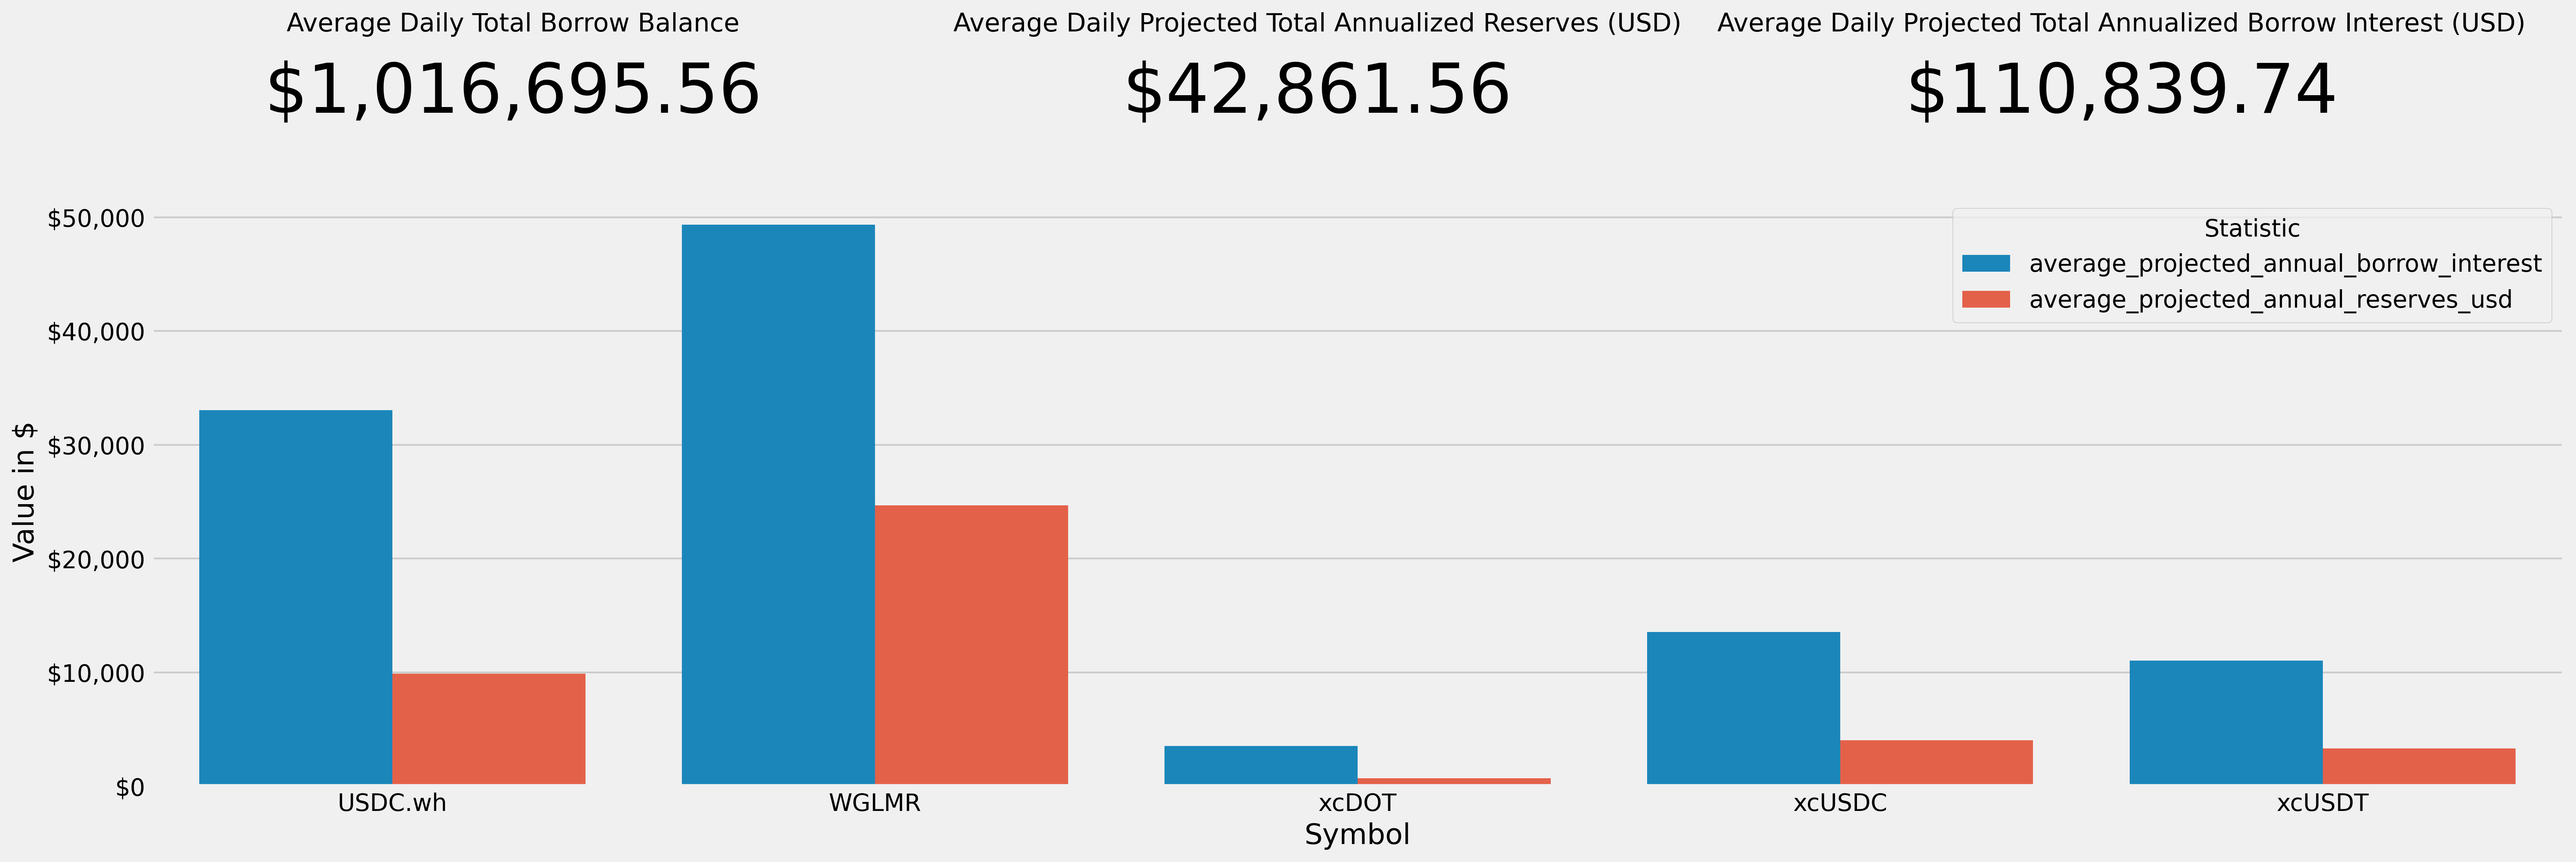
Weekly Annualized Reserve and Interest Projections
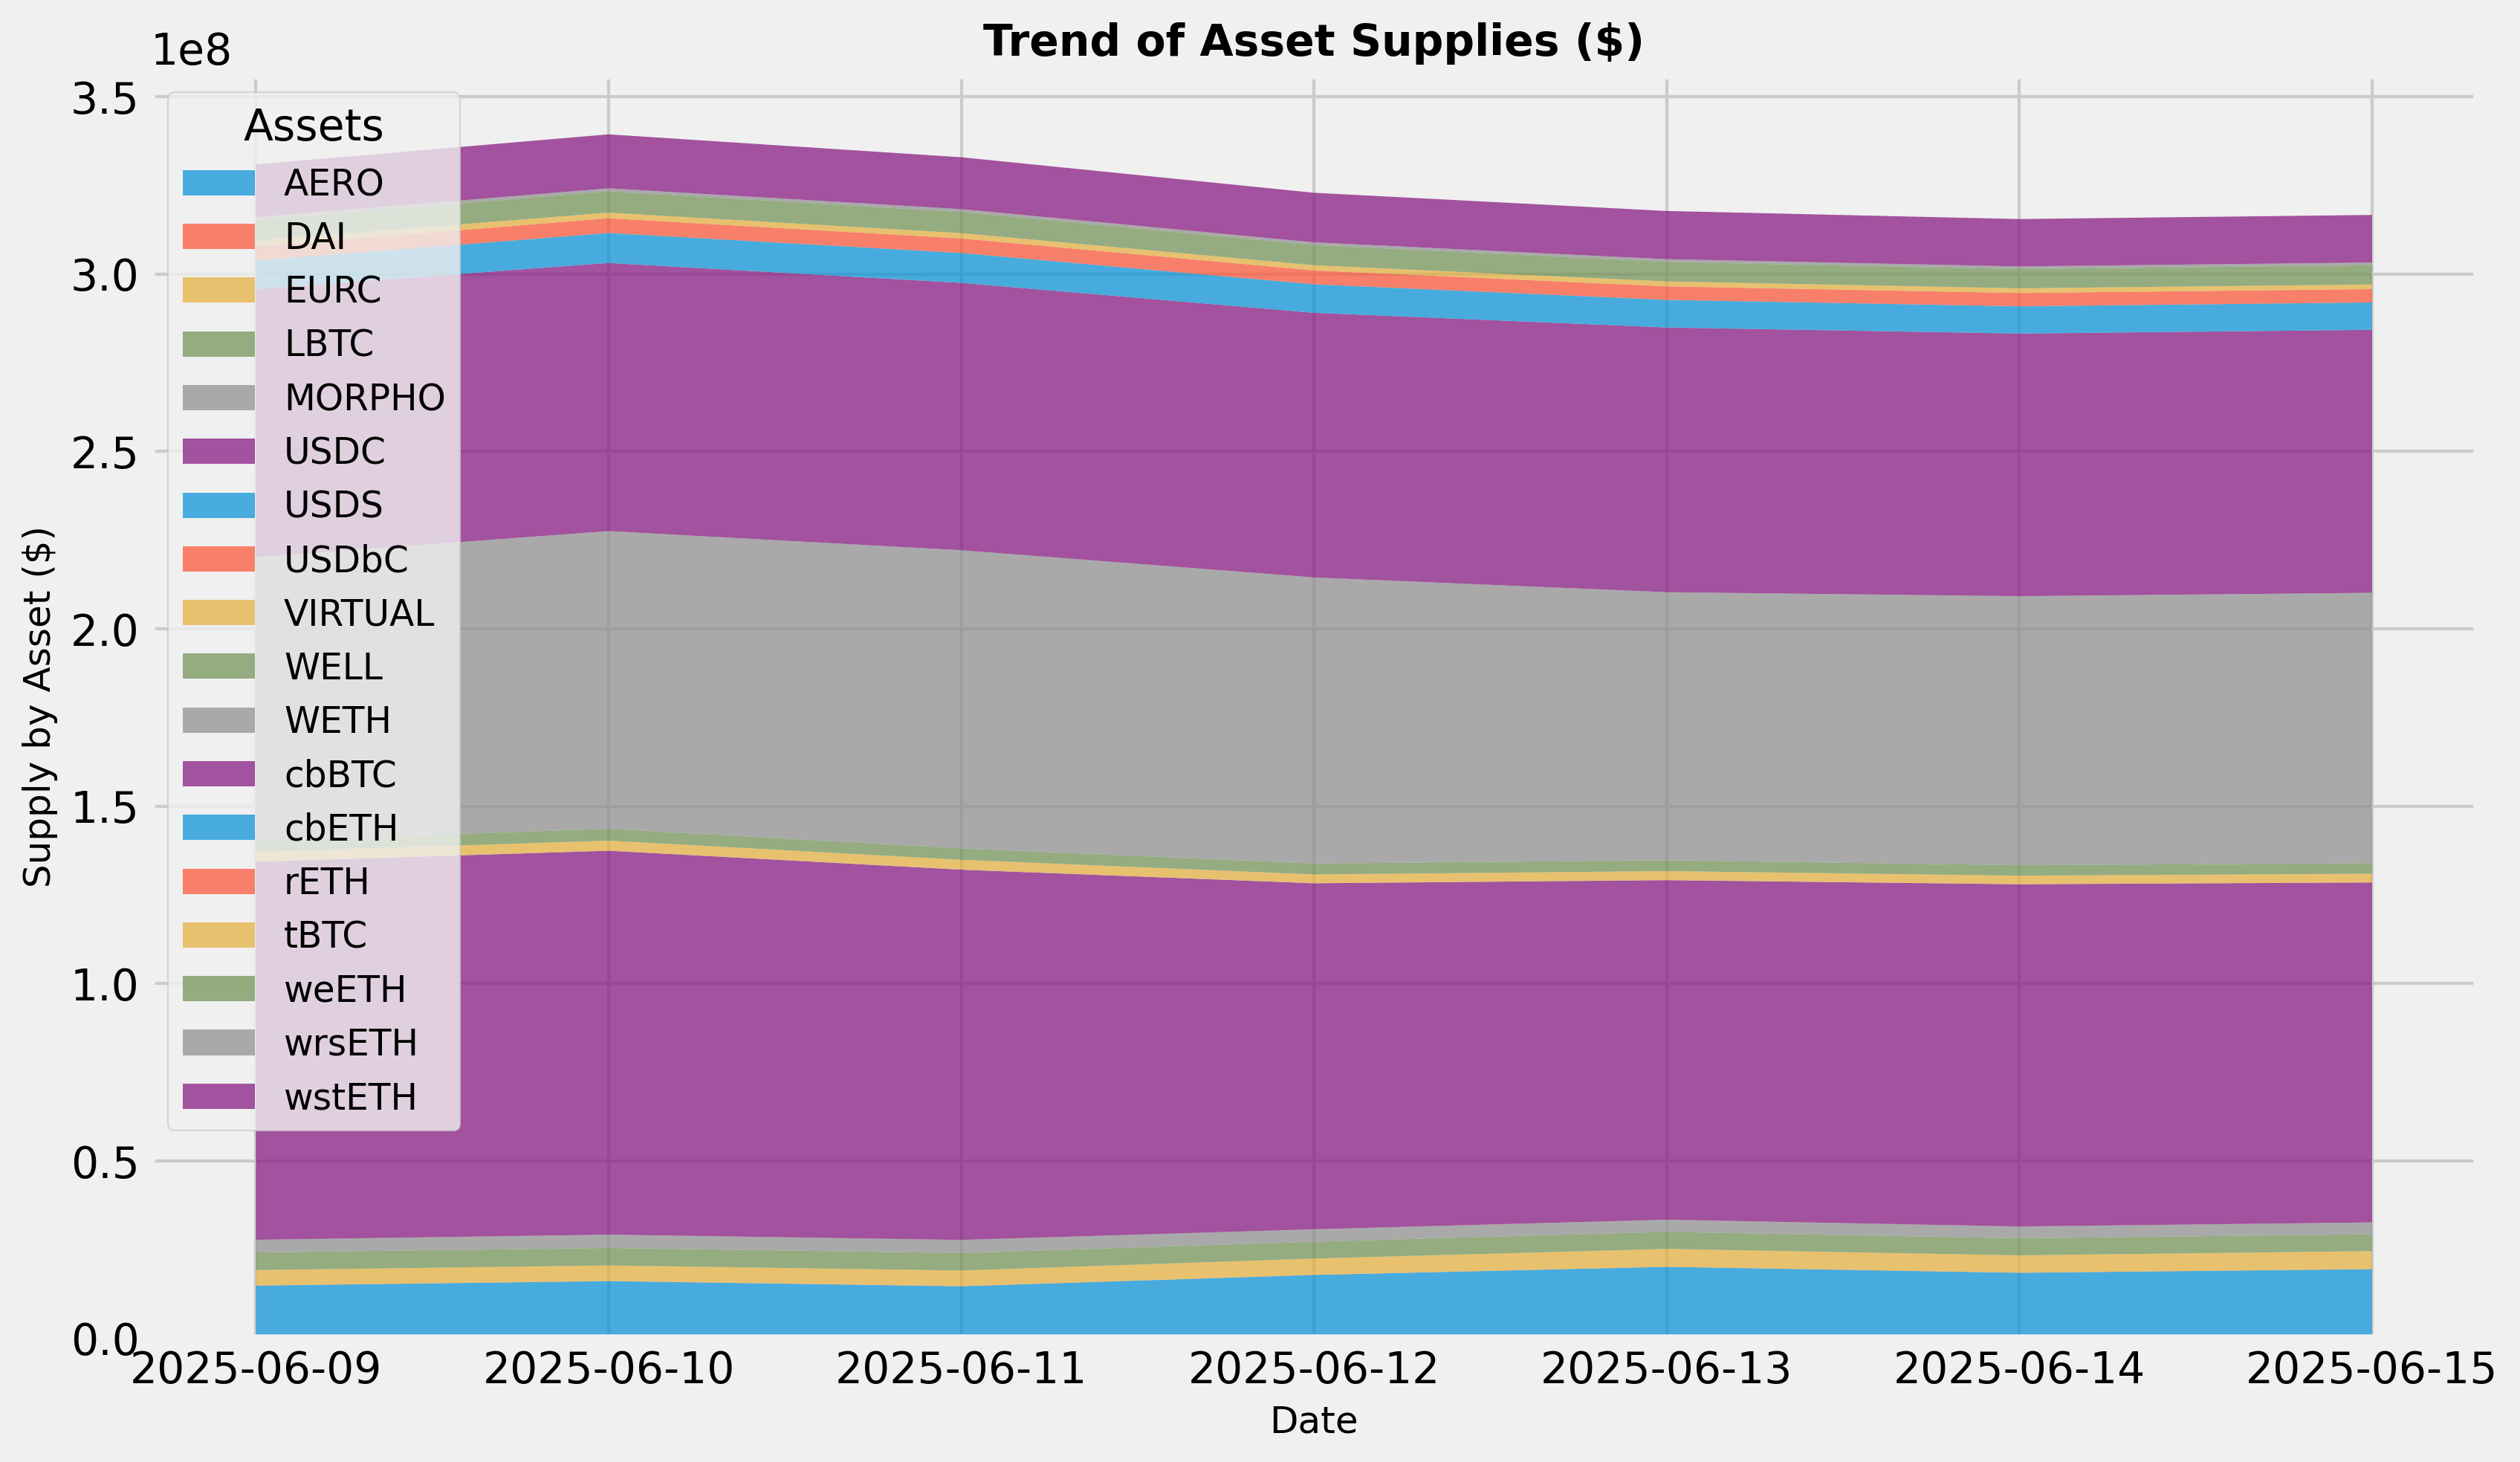
Supply Trend
This graph shows the total supply of all assets over the time frame in question. To see updated statistics, please see the live version of this graph here.
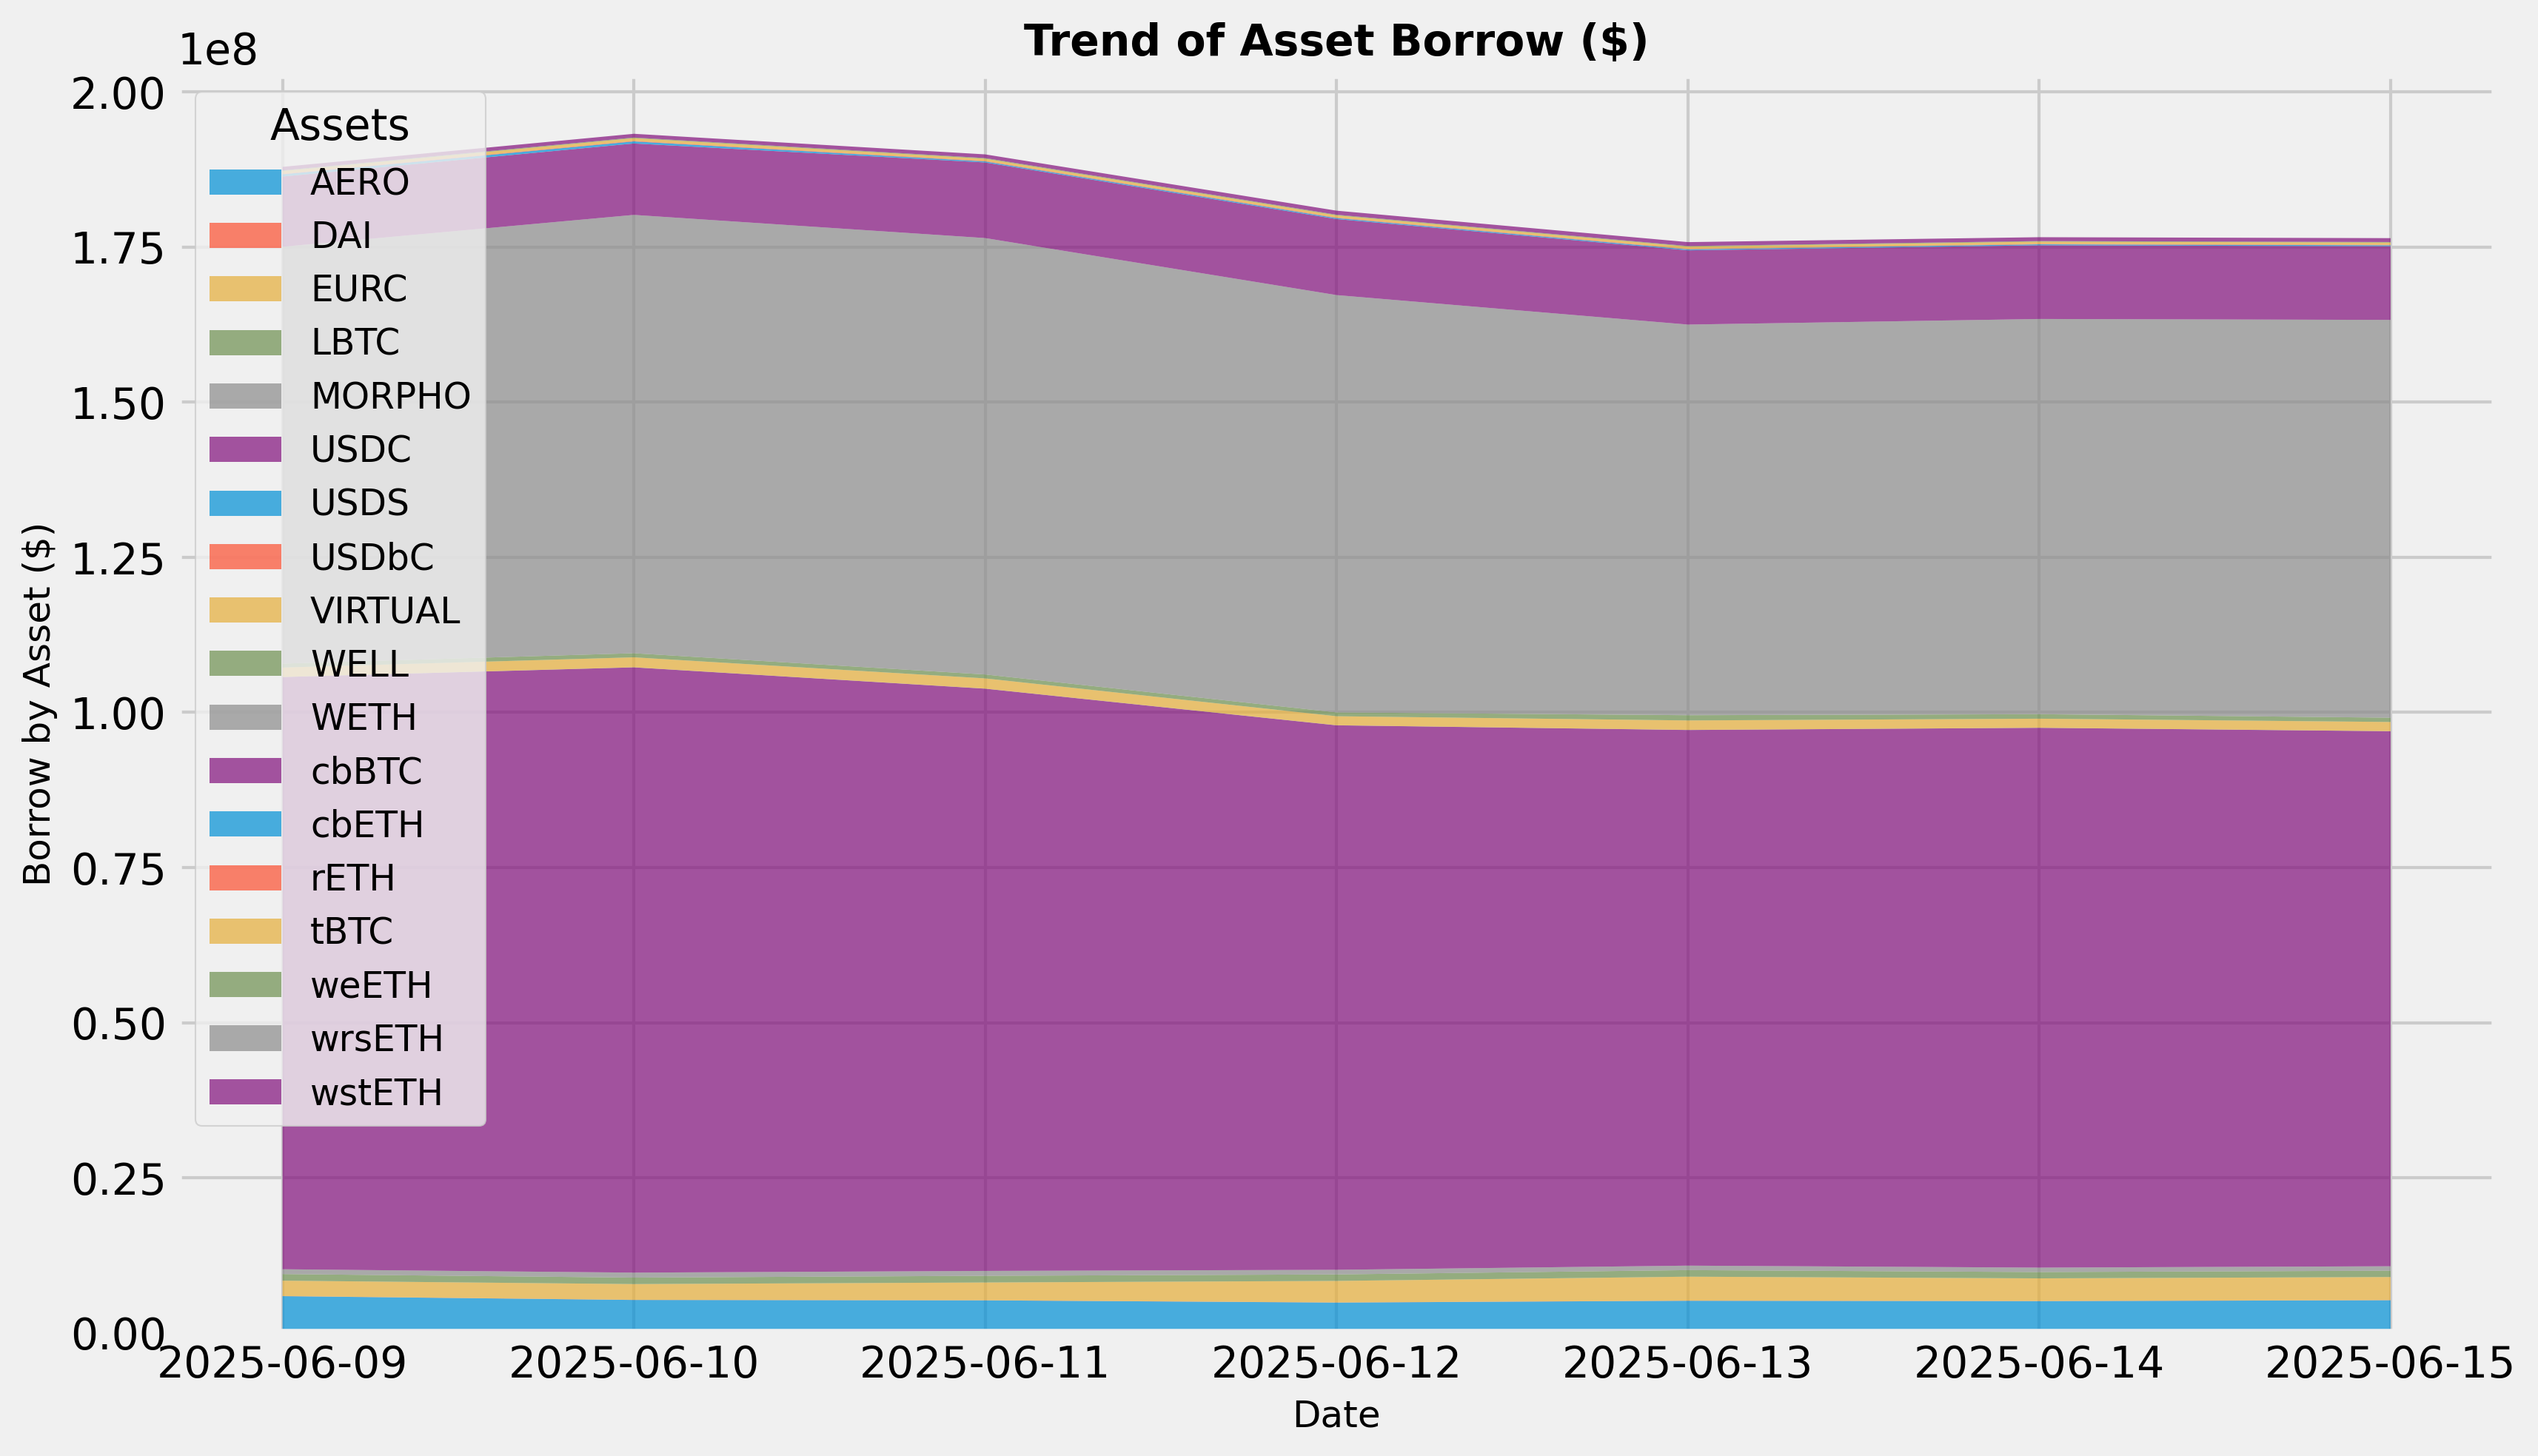
Borrows Trend
This graph shows the total borrows of all assets over the time frame in question. To see updated statistics, please see the live version of this graph here.
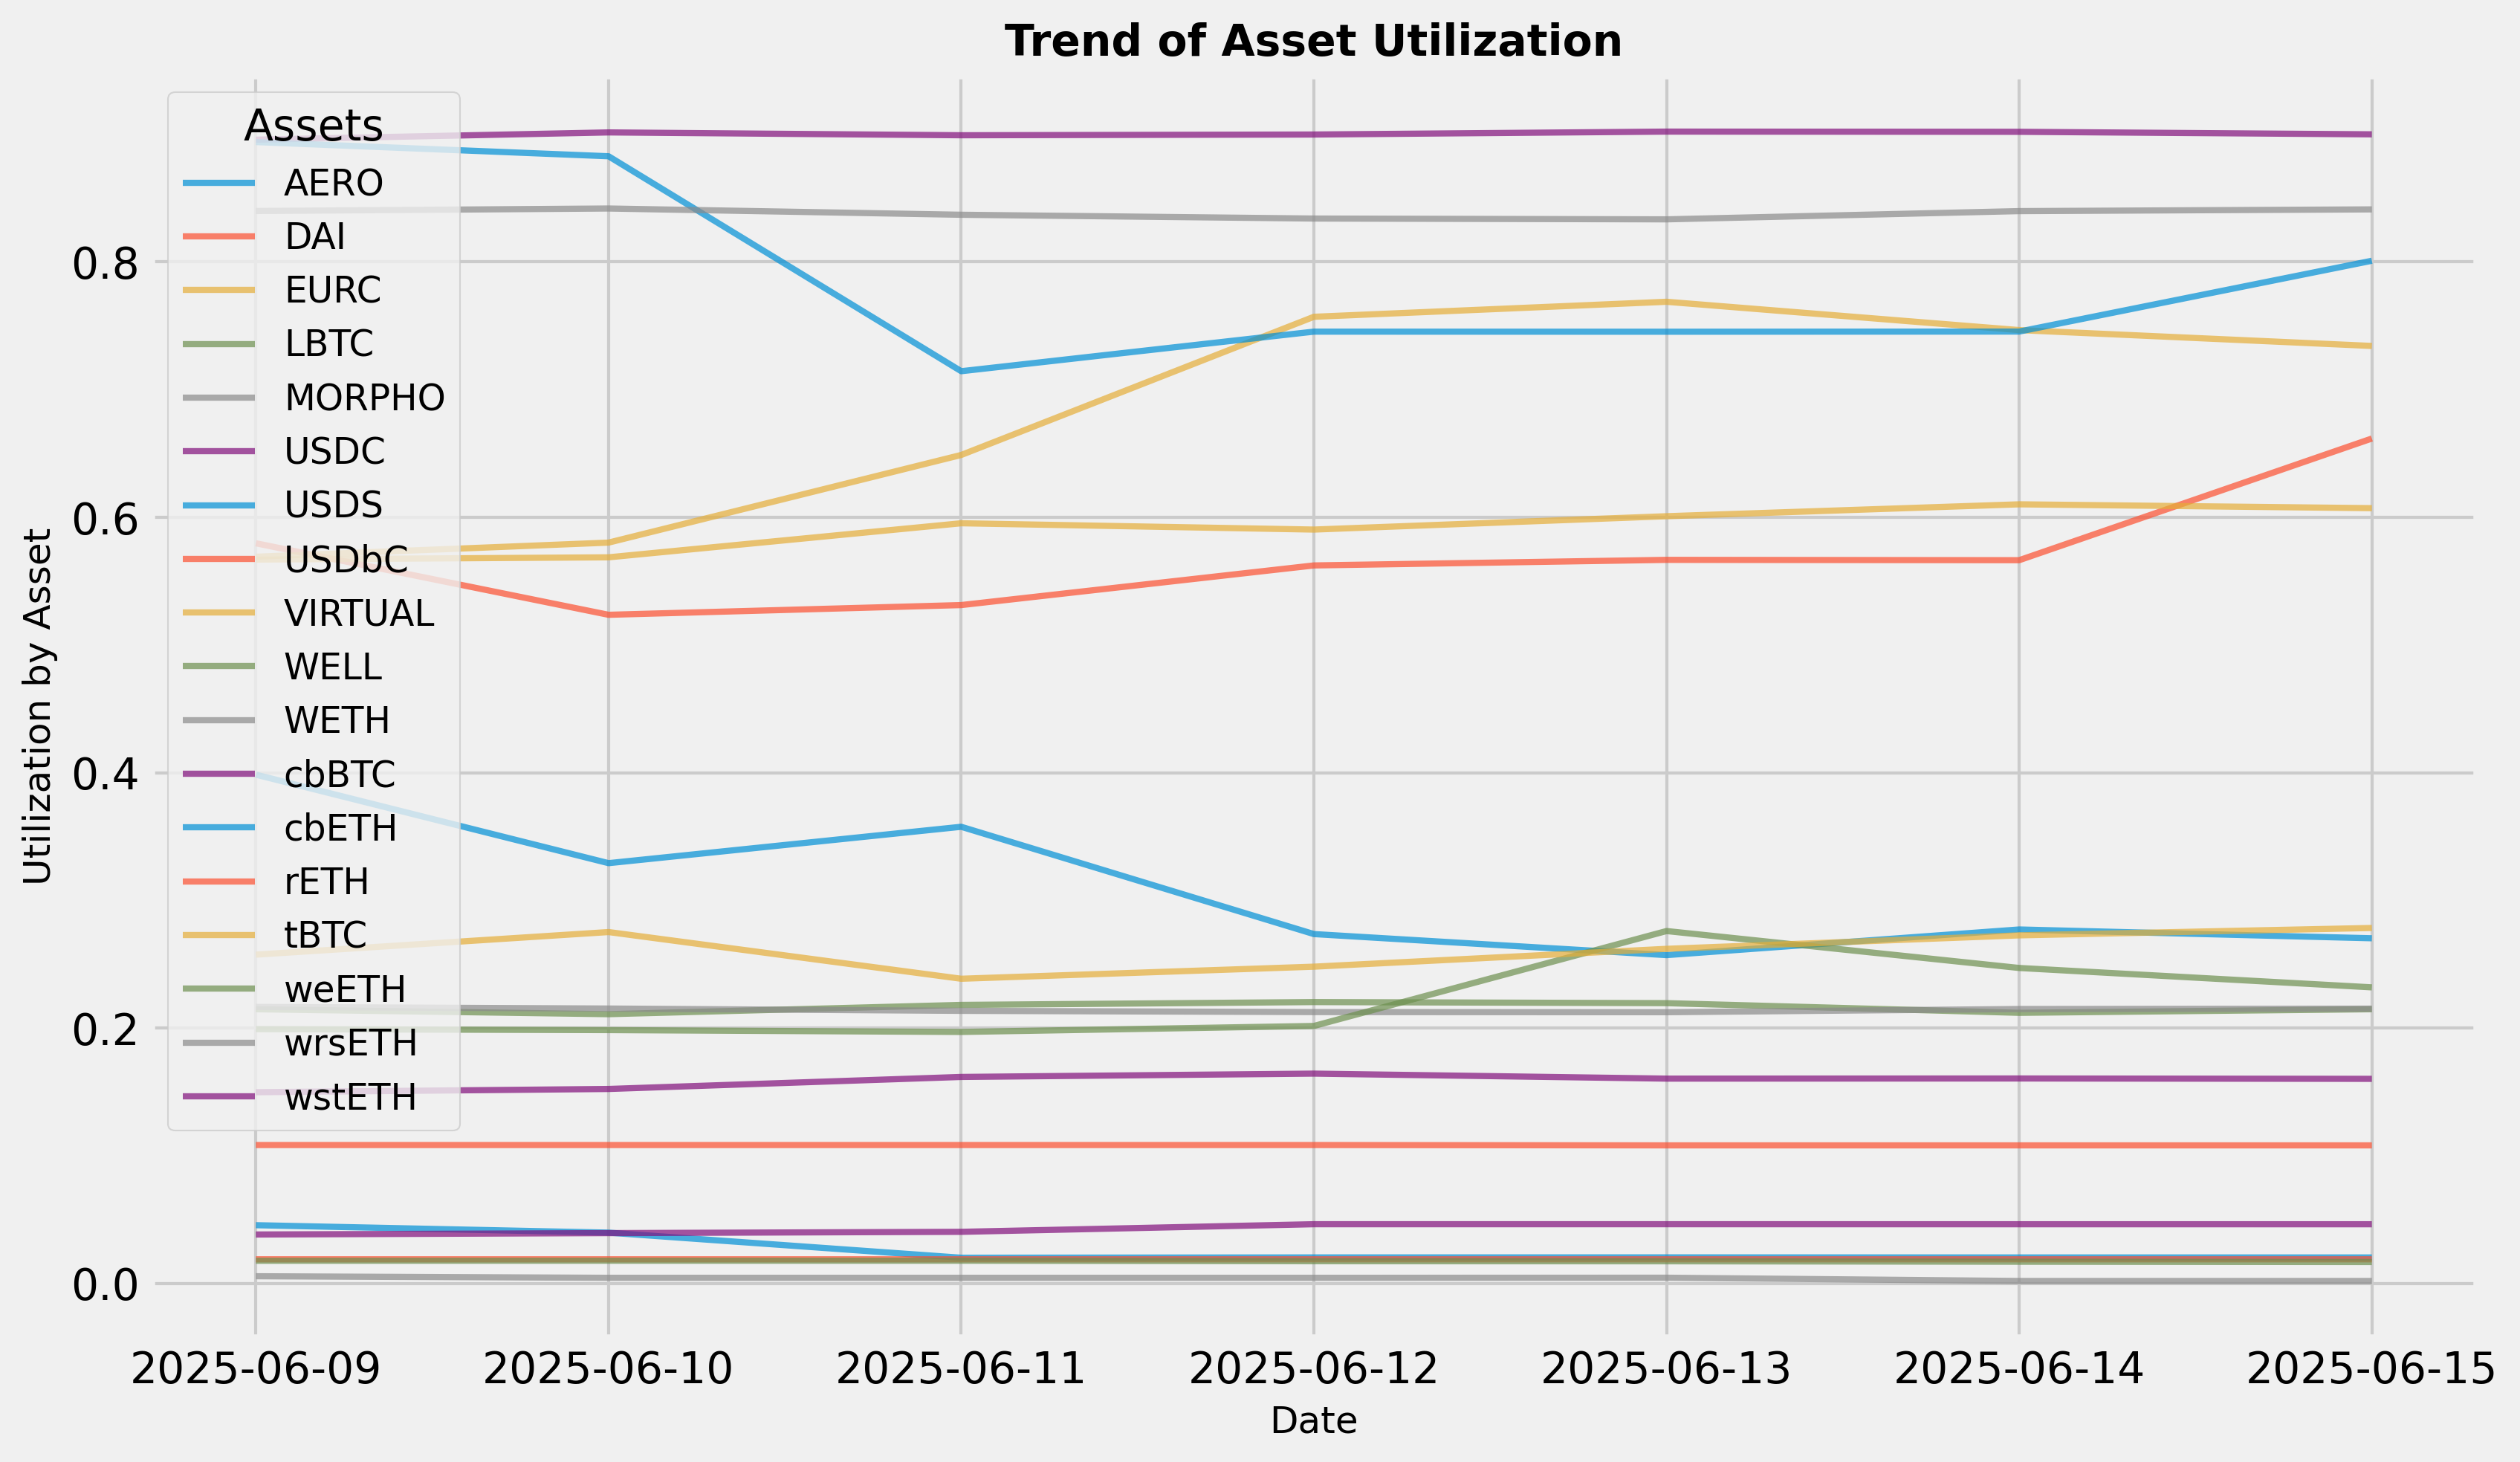
Utilization Trend
This graph shows the utilization (borrow / supply) of all assets over the time frame in question.
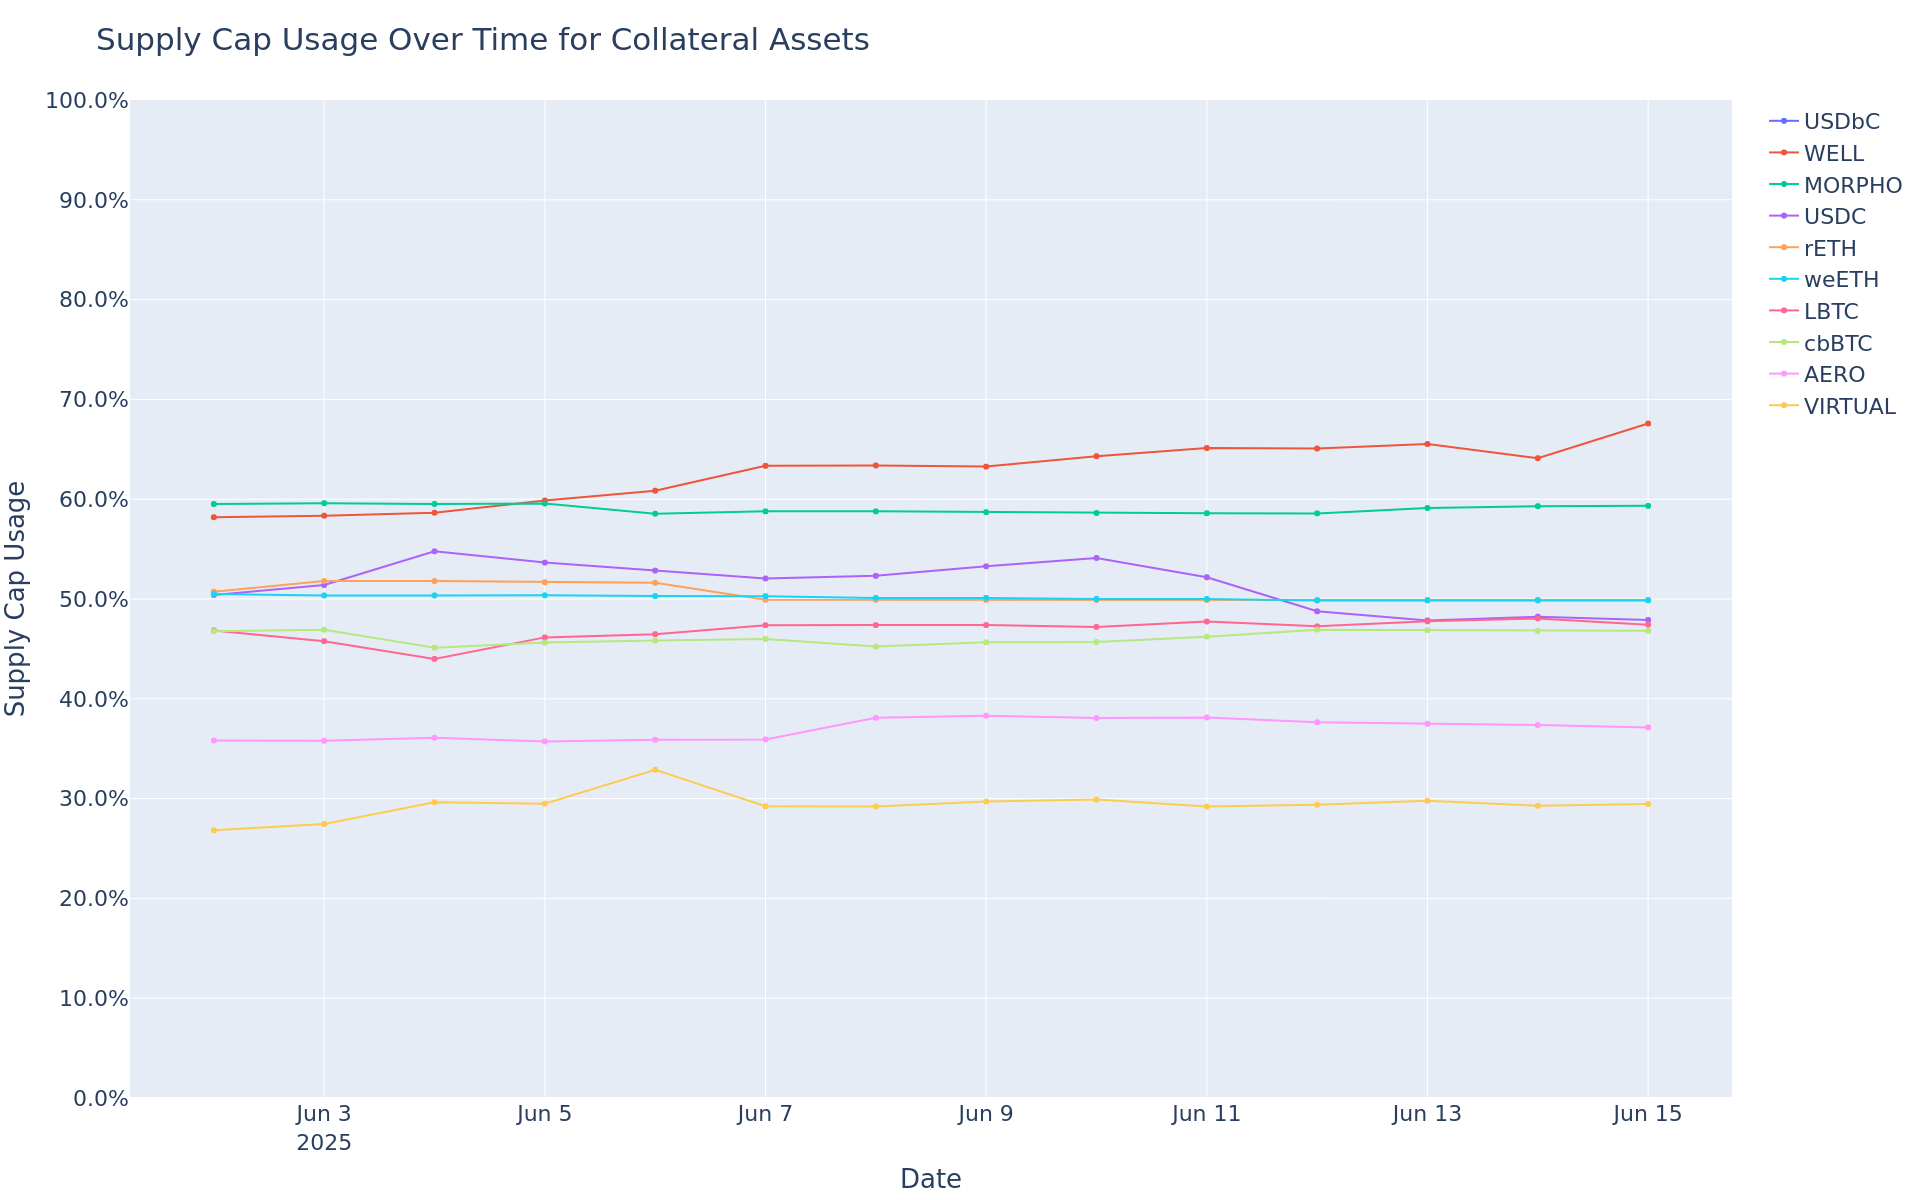
Supply Cap Usage Trend
This graph shows the supply cap usage (supply / supply cap) of all assets over the time frame in question.
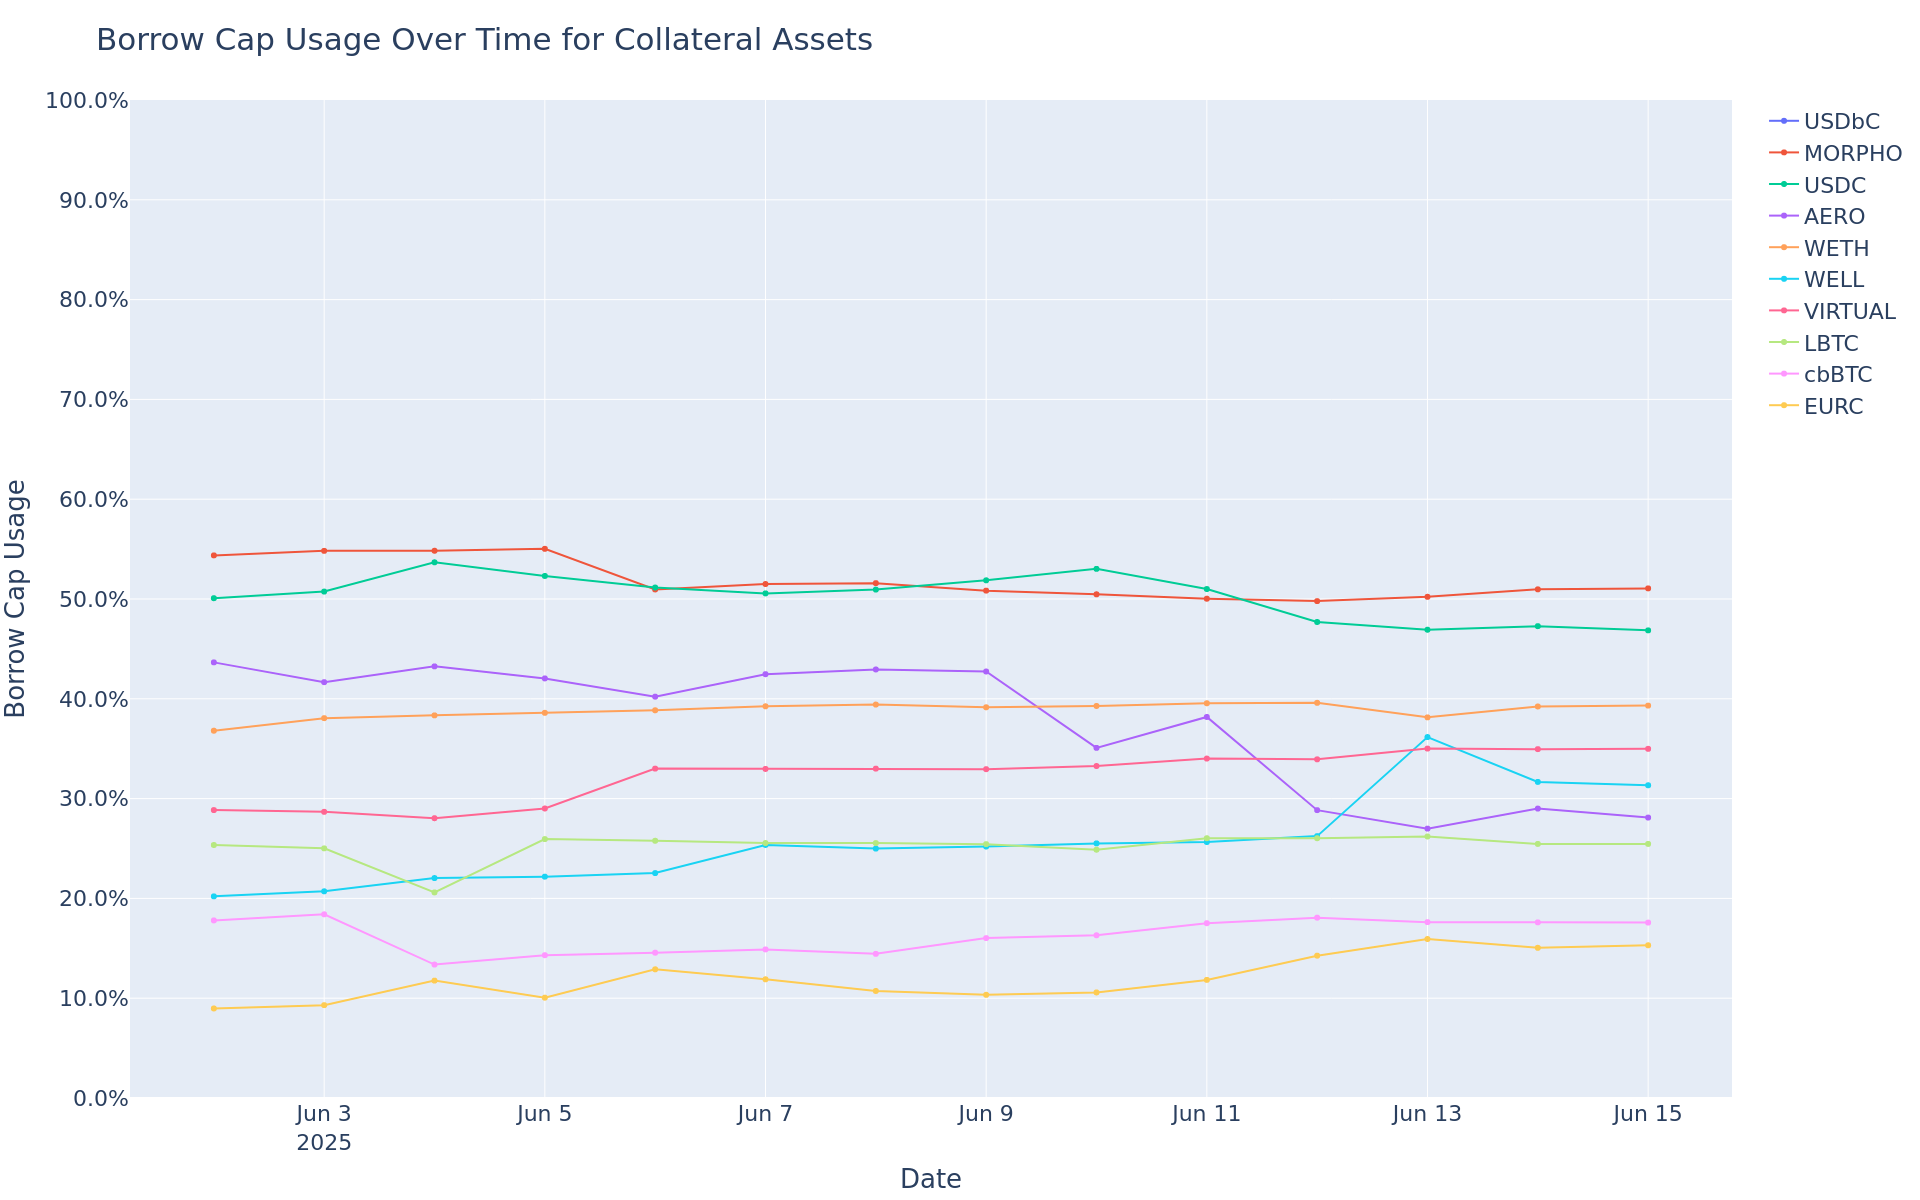
Borrow Cap Usage Trend
This graph shows the borrow cap usage (borrow / borrow cap) of all assets over the time frame in question.
Optimism
Summary
This table gives high-level statistics over the time frame in question. Bold lines correspond to weekly utilization over 75%.
| Asset | Current Borrow Cap | Average Borrow Cap Usage (Past Week) | Average Supply Balance (Past Week) | Average Utilization | Current Global 2% Depth (USD) |
|---|---|---|---|---|---|
| USDC | 34.00M | 27.11% | 11.80M | 78.11% | $339.74M |
| VELO | 20.00M | 10.62% | 36.52M | 5.81% | $410.24K |
| USDT | 18.40M | 2.28% | 465.05K | 90.14% | $1.26B |
| USD₮0 | 13.50M | 20.10% | 4.24M | 64.06% | $3.20M |
| DAI | 4.50M | 4.42% | 259.93K | 76.49% | $2.59M |
| OP | 650.00K | 17.88% | 2.29M | 5.07% | $8.06M |
| WETH | 30.00K | 34.22% | 11.73K | 87.49% | $2.33M |
| wstETH | 1.50K | 4.75% | 982.79 | 7.26% | $613.90K |
| rETH | 340.00 | 4.49% | 109.79 | 13.91% | $131.93K |
| weETH | 110.00 | 22.79% | 843.69 | 2.97% | $393.65K |
| cbETH | 0.10 | 2.16% | 0.90 | 0.24% | $142.68K |
| WBTC | 0.00 | 3.19K% | 0.07 | 4.47% | $3.75M |
| VELO | 0.00 | 0.00% | 0.00 | 0.00% | $410.24K |
Top Movers
- USDT0’s borrow balance increased WoW by 28% from $2M to $3M.
- DAI’s borrow balance decreased WoW by 34% from $235K to $156K.
- OP’s supply balance increased WoW by 9% from $1M to $1M.
- USDT’s supply balance decreased WoW by 31% from $468K to $323K.
- USD₮0’s utilization increased WoW by 34% from 49% to 65%.
- OP’s utilization decreased WoW by 11% from 5% to 5%.
Liquidations
| Liquidated Asset | Liquidated Amount (Tokens) | Liquidated Amount (USD) |
|---|---|---|
| mWETH | 0.16 | $409.56 |
| mOP | 284.32 | $167.70 |
| mVELO | 169.40 | $8.95 |
| mUSDC | 6.53 | $6.52 |
| mUSDT0 | 2.68 | $2.68 |
Weekly Annualized Reserve and Interest Projections
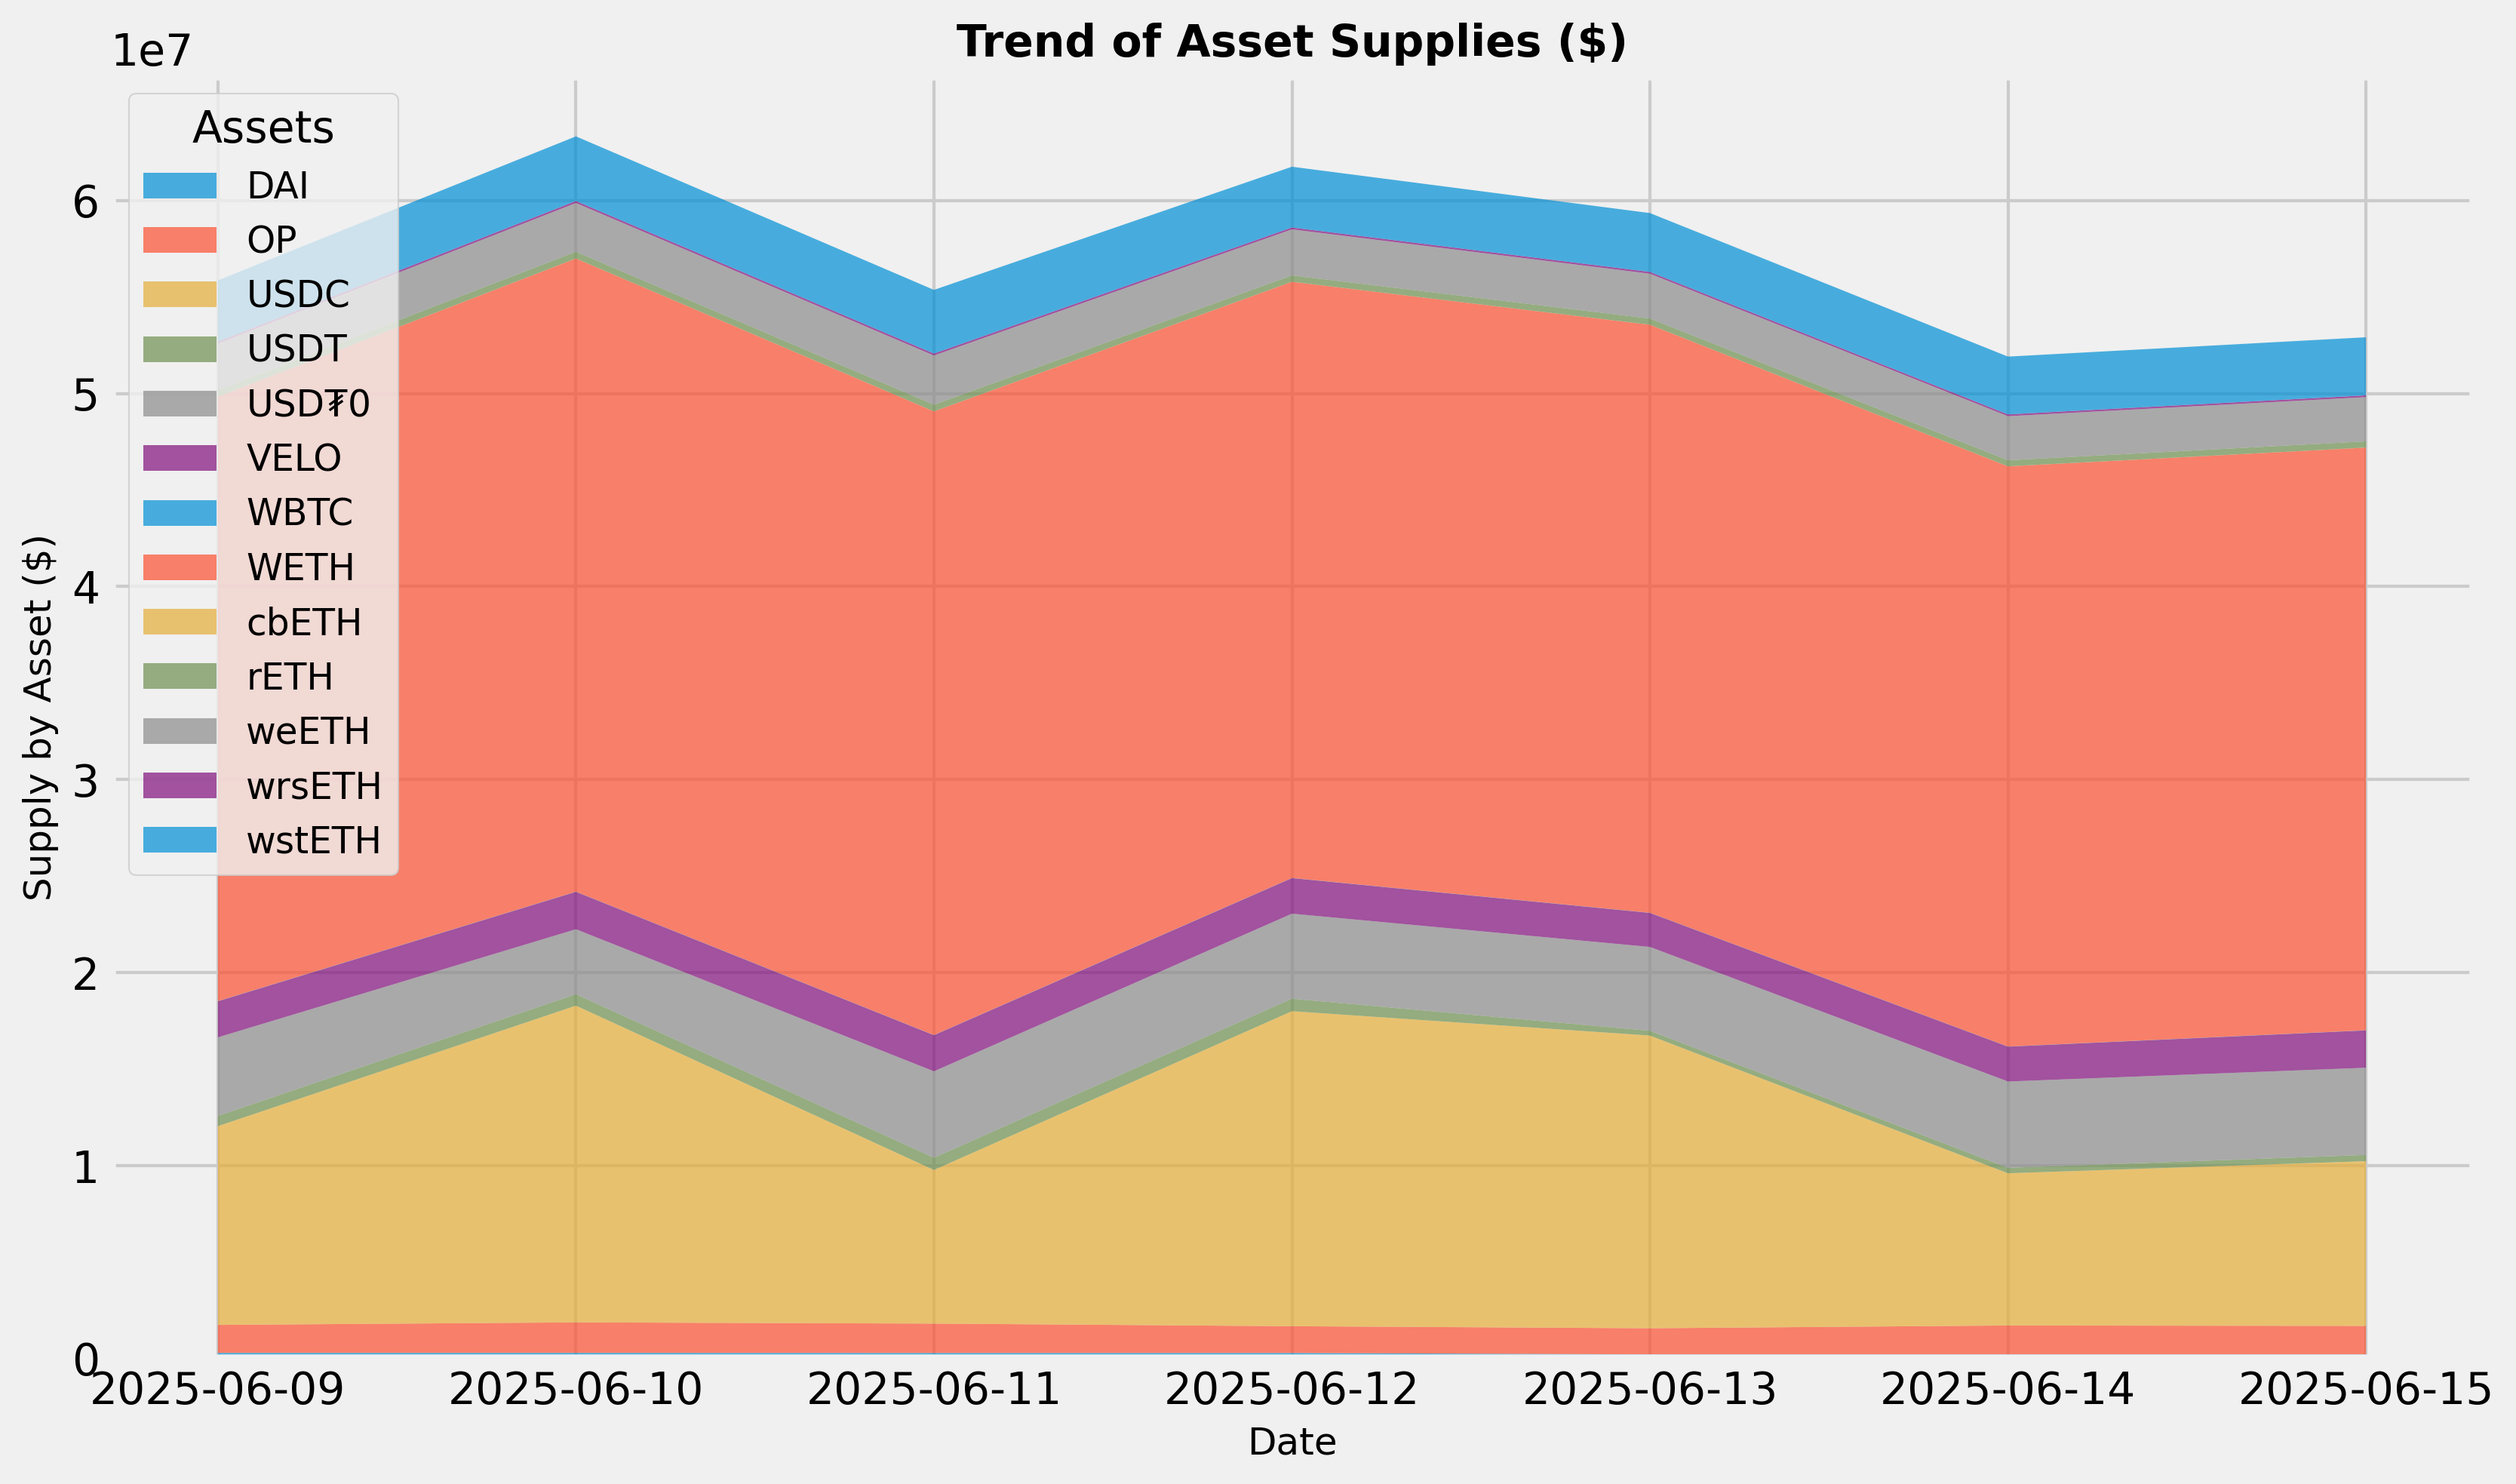
Supply Trend
This graph shows the total supply of all assets over the time frame in question. To see updated statistics, please see the live version of this graph here.
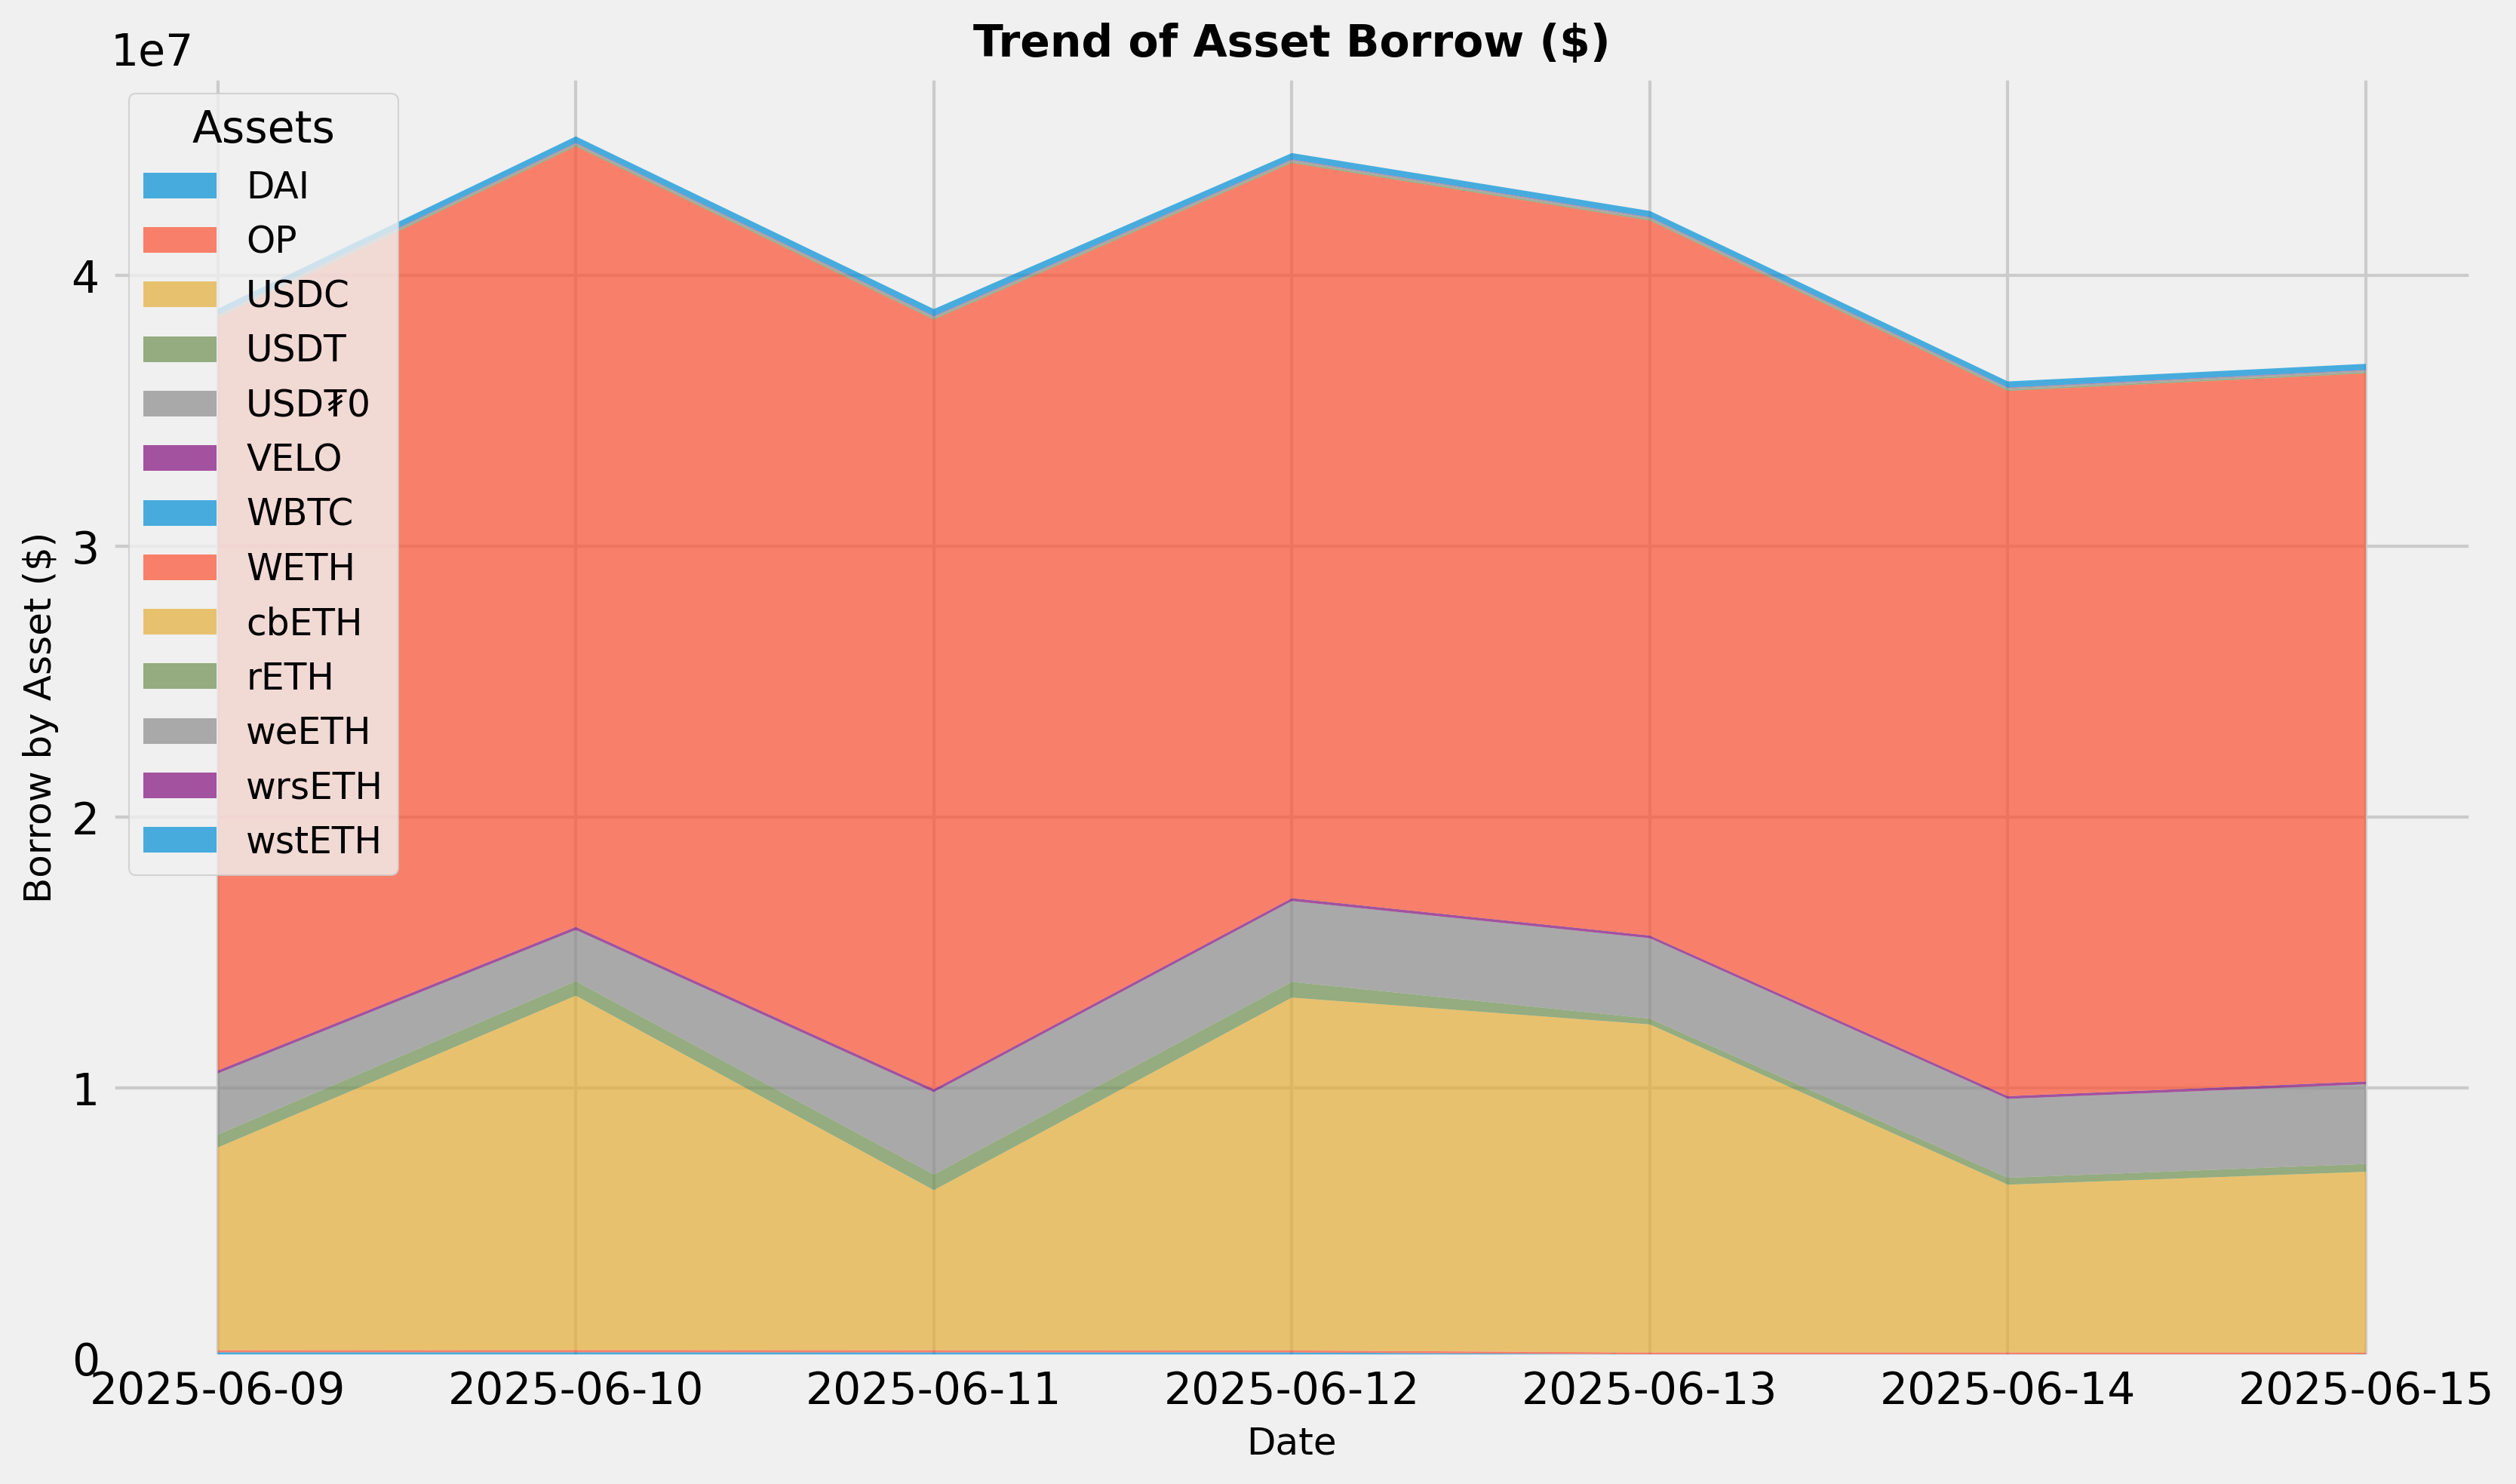
Borrows Trend
This graph shows the total borrows of all assets over the time frame in question. To see updated statistics, please see the live version of this graph here.
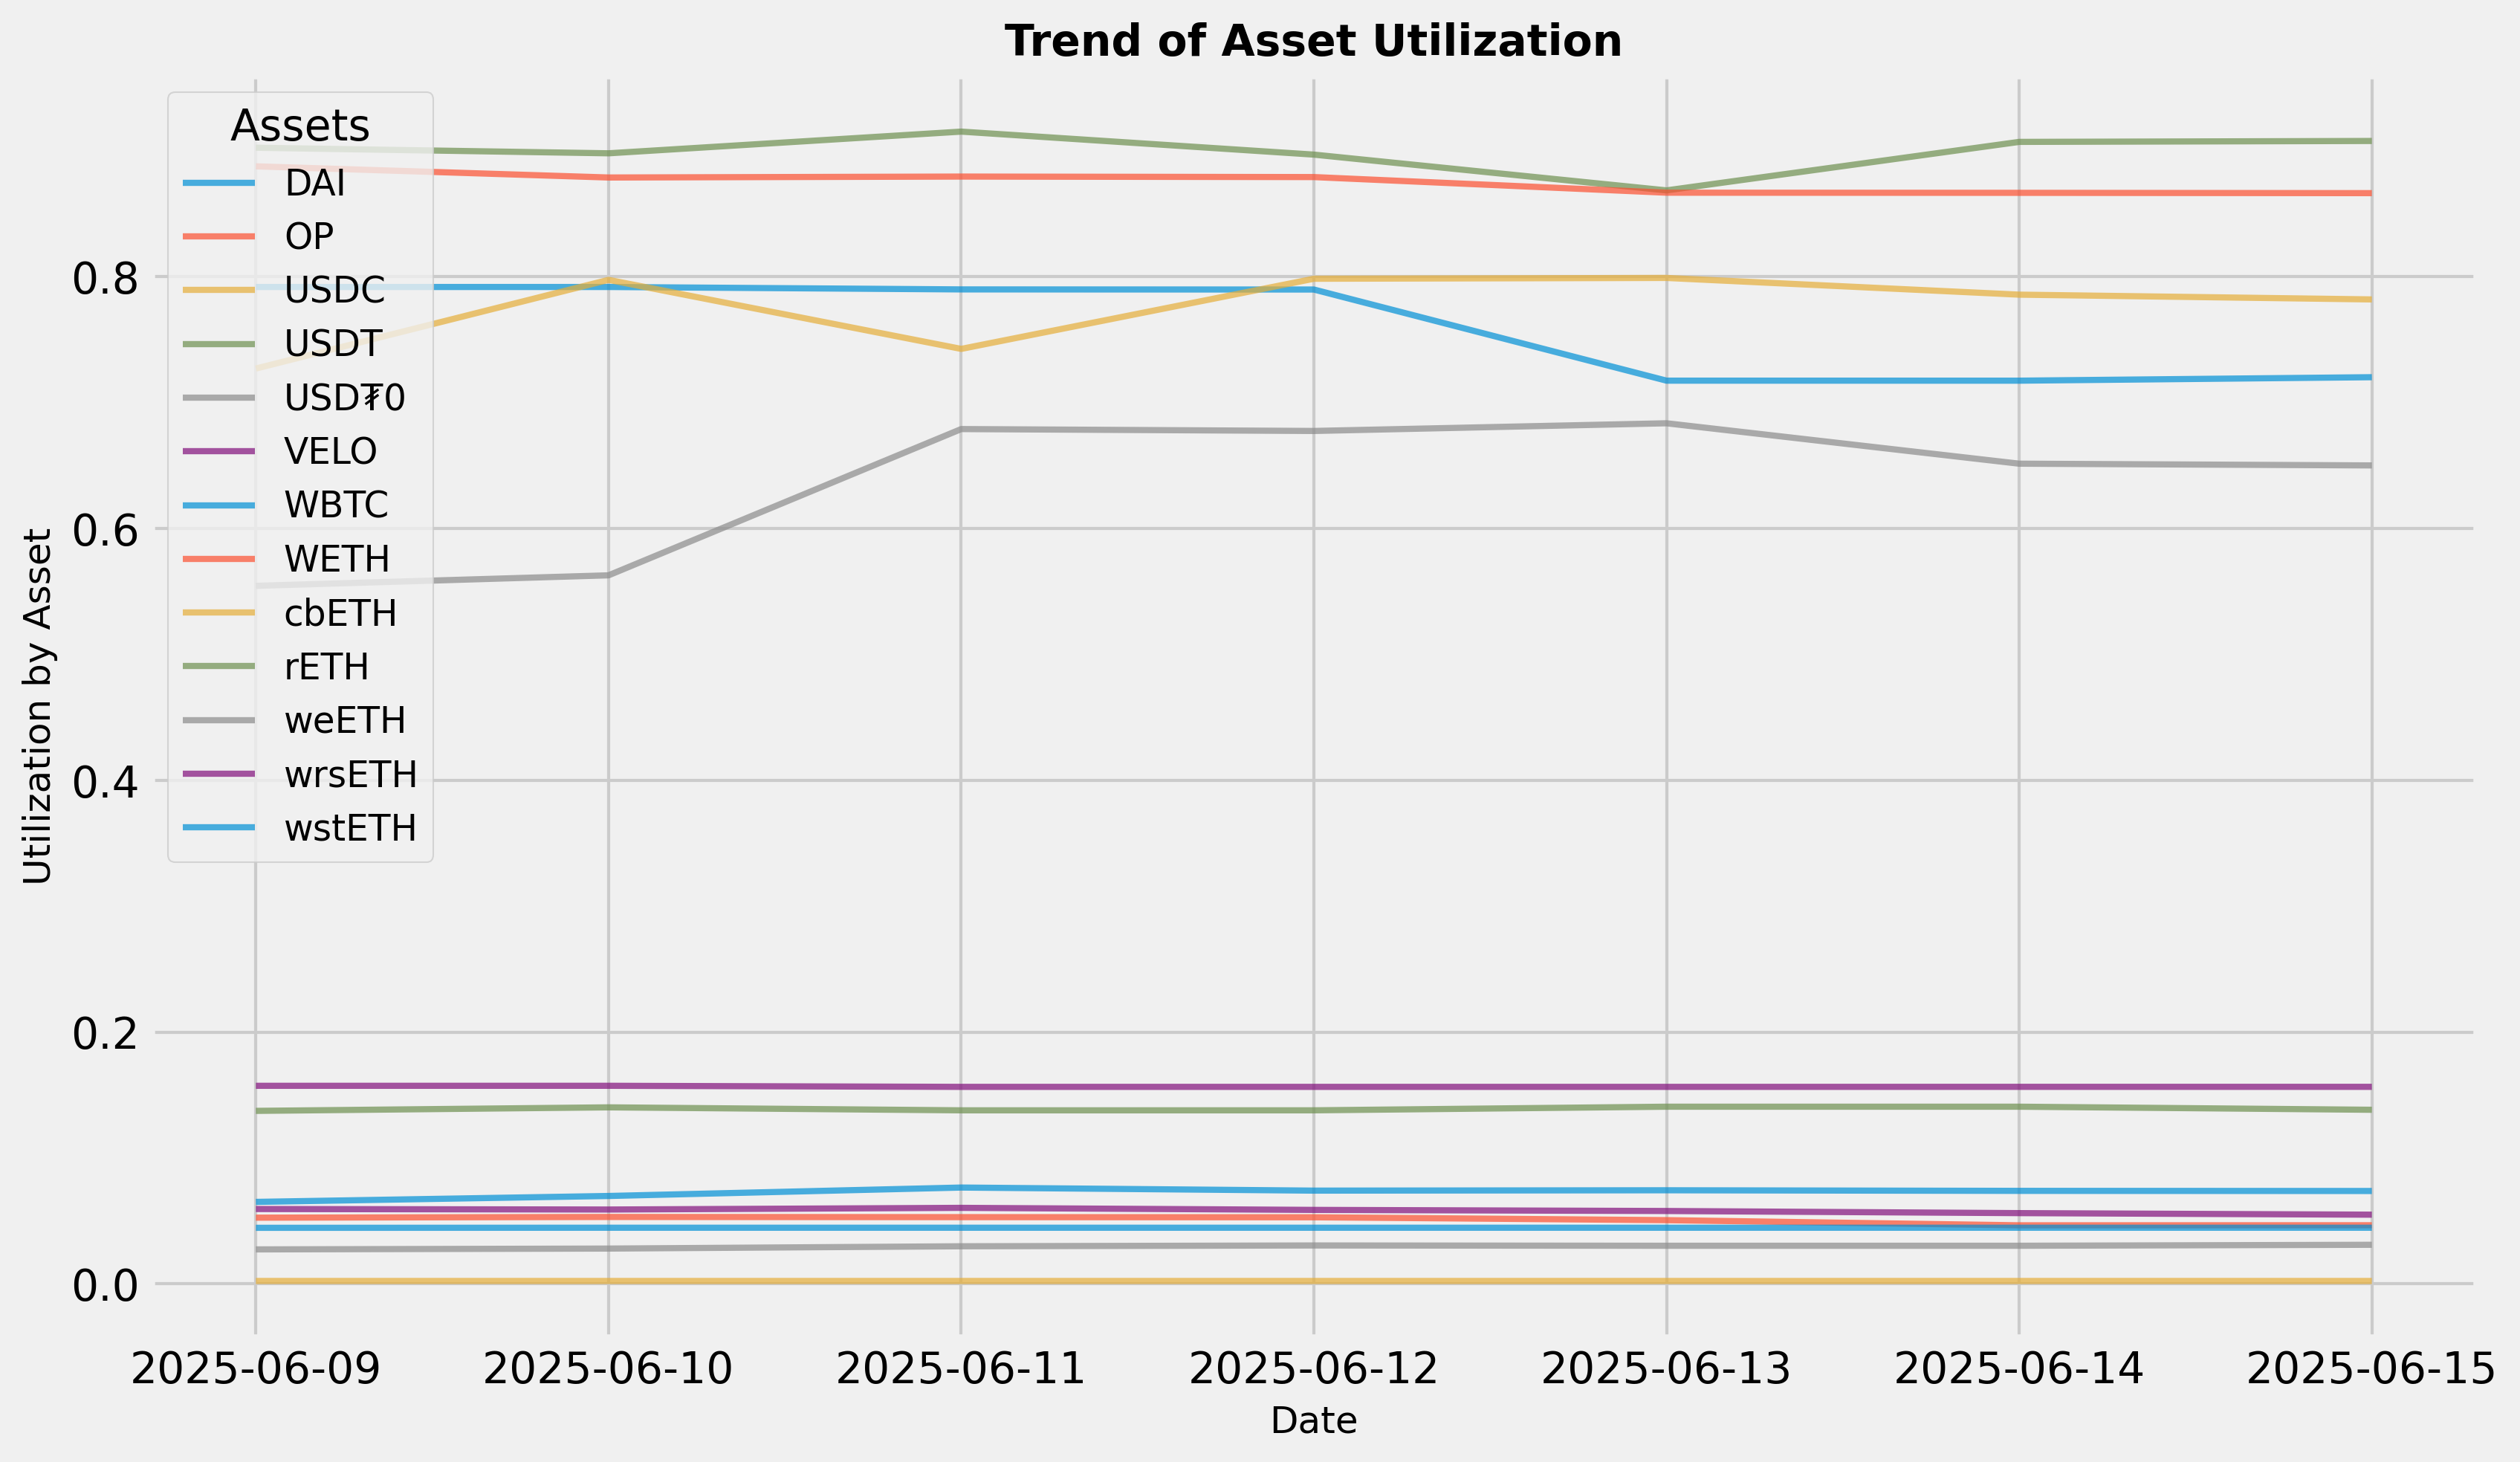
Utilization Trend
This graph shows the utilization (borrow / supply) of all assets over the time frame in question.
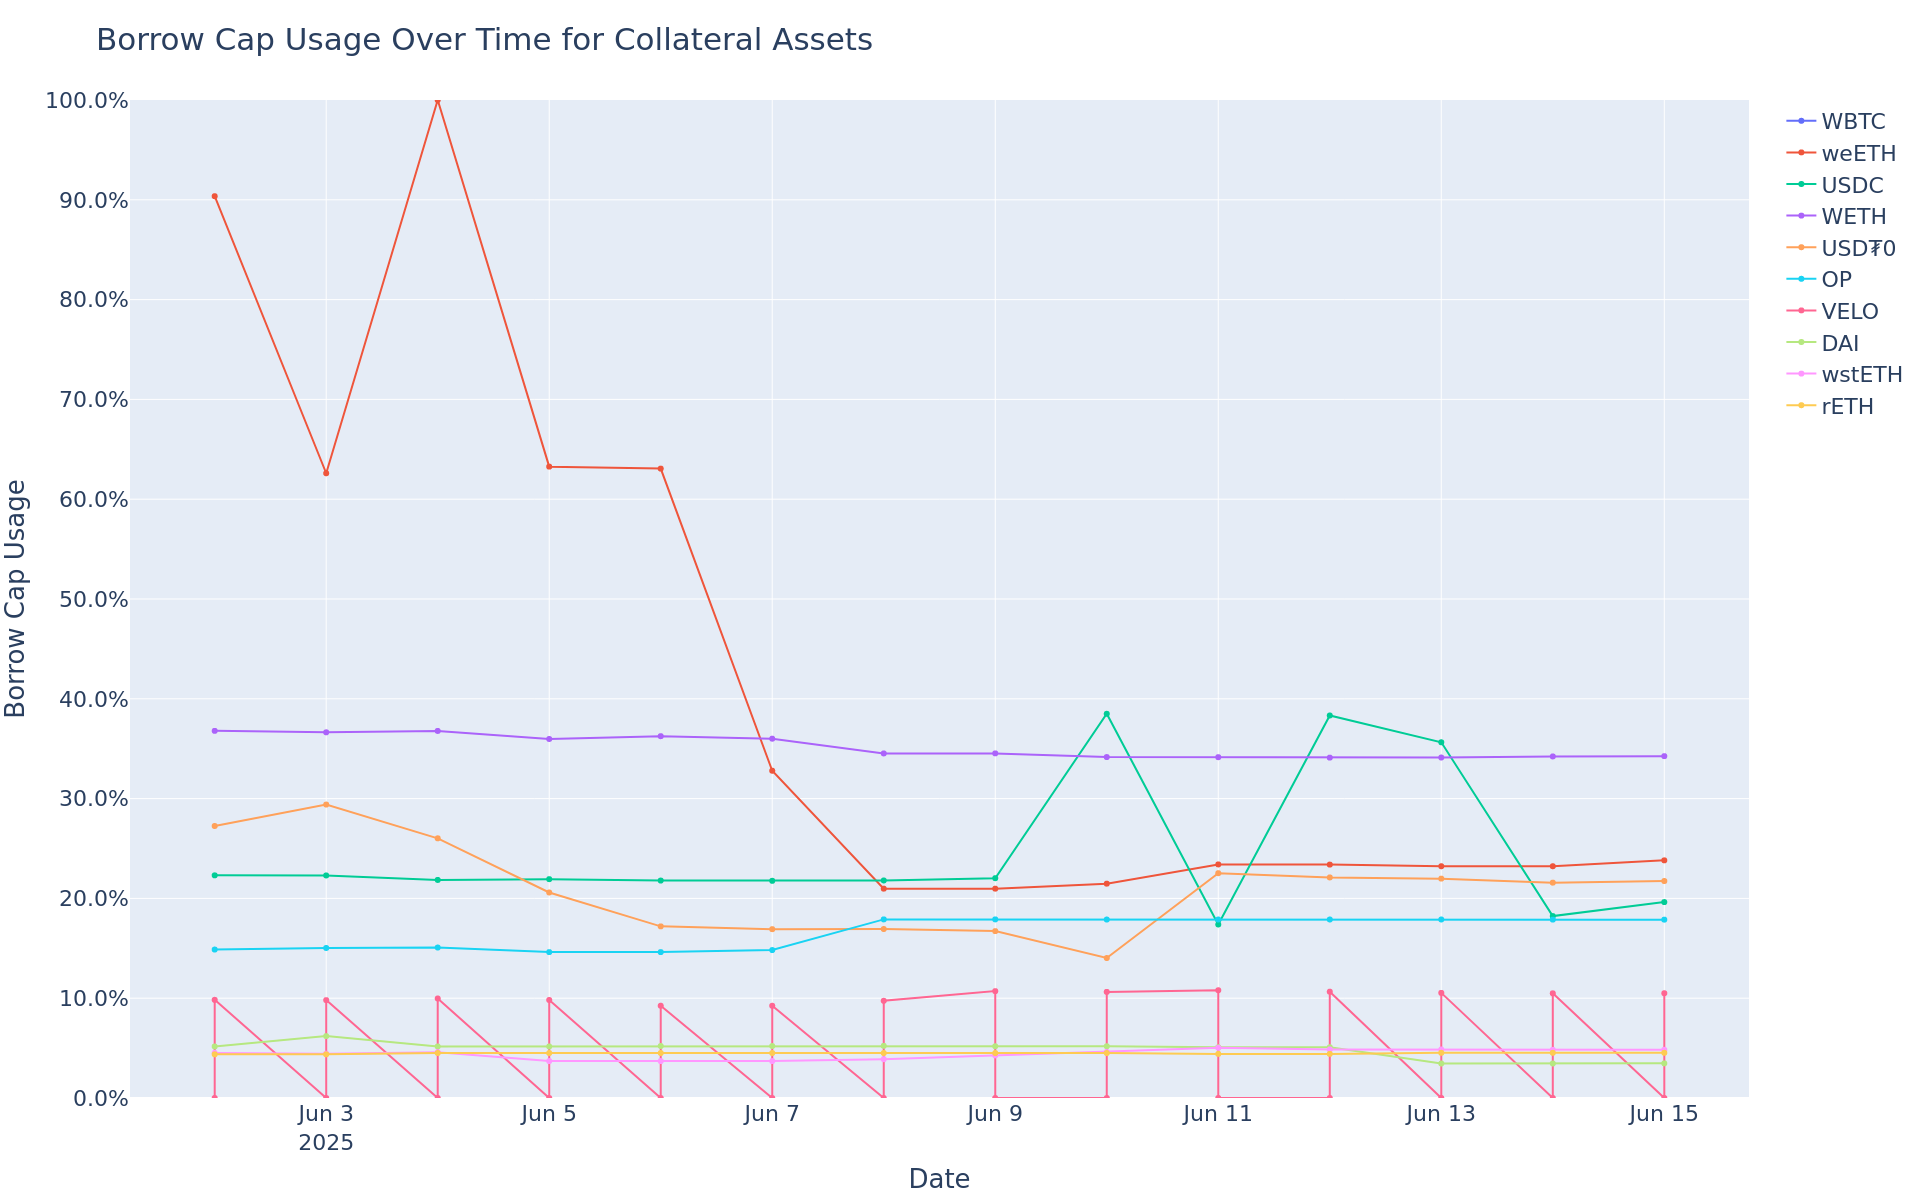
Borrow Cap Usage Trend
This graph shows the borrow cap usage (borrow / borrow cap) of all assets over the time frame in question.
Moonbeam
Summary
This table gives high-level statistics over the time frame in question. Bold lines correspond to weekly utilization over 75%.
| Asset | Current Borrow Cap | Average Borrow Cap Usage (Past Week) | Average Supply Balance (Past Week) | Average Utilization | Current Global 2% Depth (USD) |
|---|---|---|---|---|---|
| FRAX | 0.10 | 734.60K% | 61.96K | 1.19% | $16.59K |
| WETH.wh | 0.10 | 2.37K% | 42.31 | 5.61% | $2.33M |
| WBTC.wh | 0.10 | 39.73% | 0.91 | 4.37% | $3.75M |
| USDC.wh | 0.10 | 69.90M% | 98.80K | 70.74% | $339.74M |
| xcUSDC | 0.10 | 169.20M% | 297.05K | 56.96% | $339.74M |
Top Movers
- WBTC.wh’s borrow balance increased WoW by 185% from $1K to $4K.
- WGLMR’s borrow balance decreased WoW by 14% from $550K to $473K.
- USDC.wh’s supply balance increased WoW by 9% from $91K to $99K.
- WGLMR’s supply balance decreased WoW by 19% from $1M to $893K.
- WBTC.wh’s utilization increased WoW by 200% from 1% to 4%.
- USDC.wh’s utilization decreased WoW by 12% from 79% to 69%.
- No asset has supply or borrow cap usage above 75%.
Liquidations
| Liquidated Asset | Liquidated Amount (Tokens) | Liquidated Amount (USD) |
|---|---|---|
| mDOT | 969.81 | $3.66K |
| mxcUSDT | 197.85 | $197.92 |
| mGLMR | 1.55K | $115.75 |
| mFRAX | 9.15 | $9.14 |
Weekly Annualized Reserve and Interest Projections
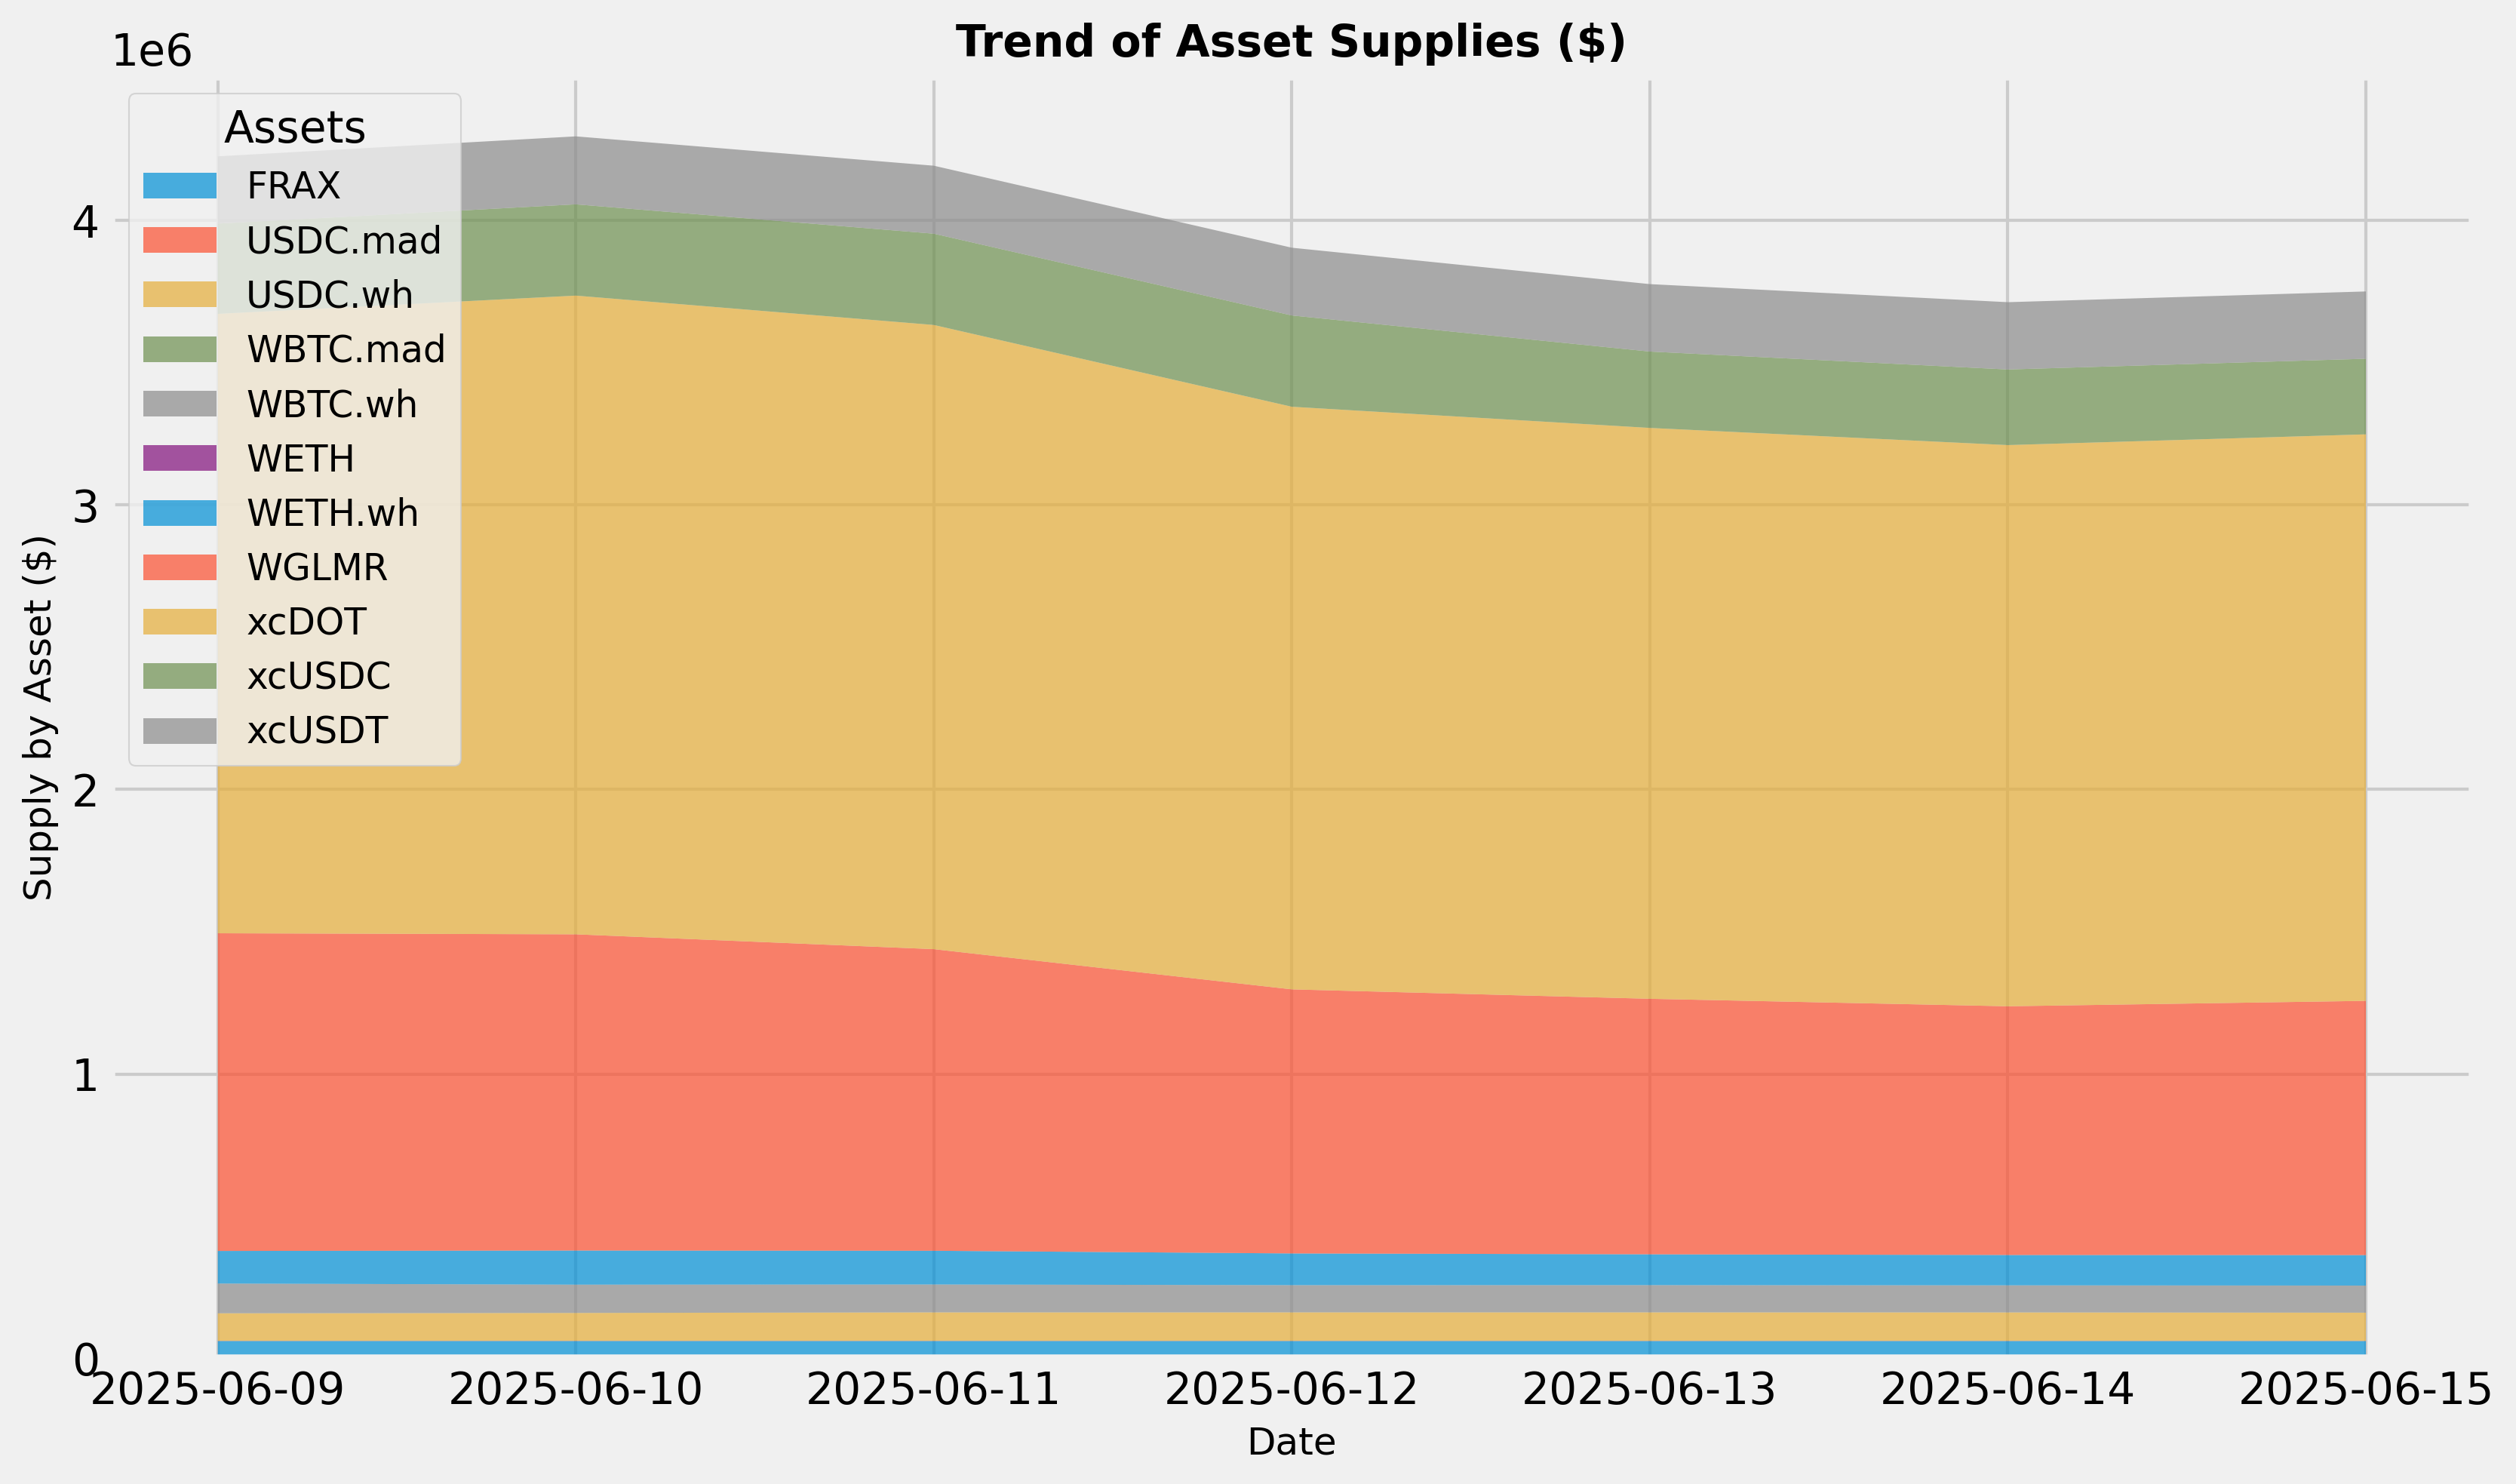
Supply Trend
This graph shows the total supply of all assets over the time frame in question. To see updated statistics, please see the live version of this graph here.
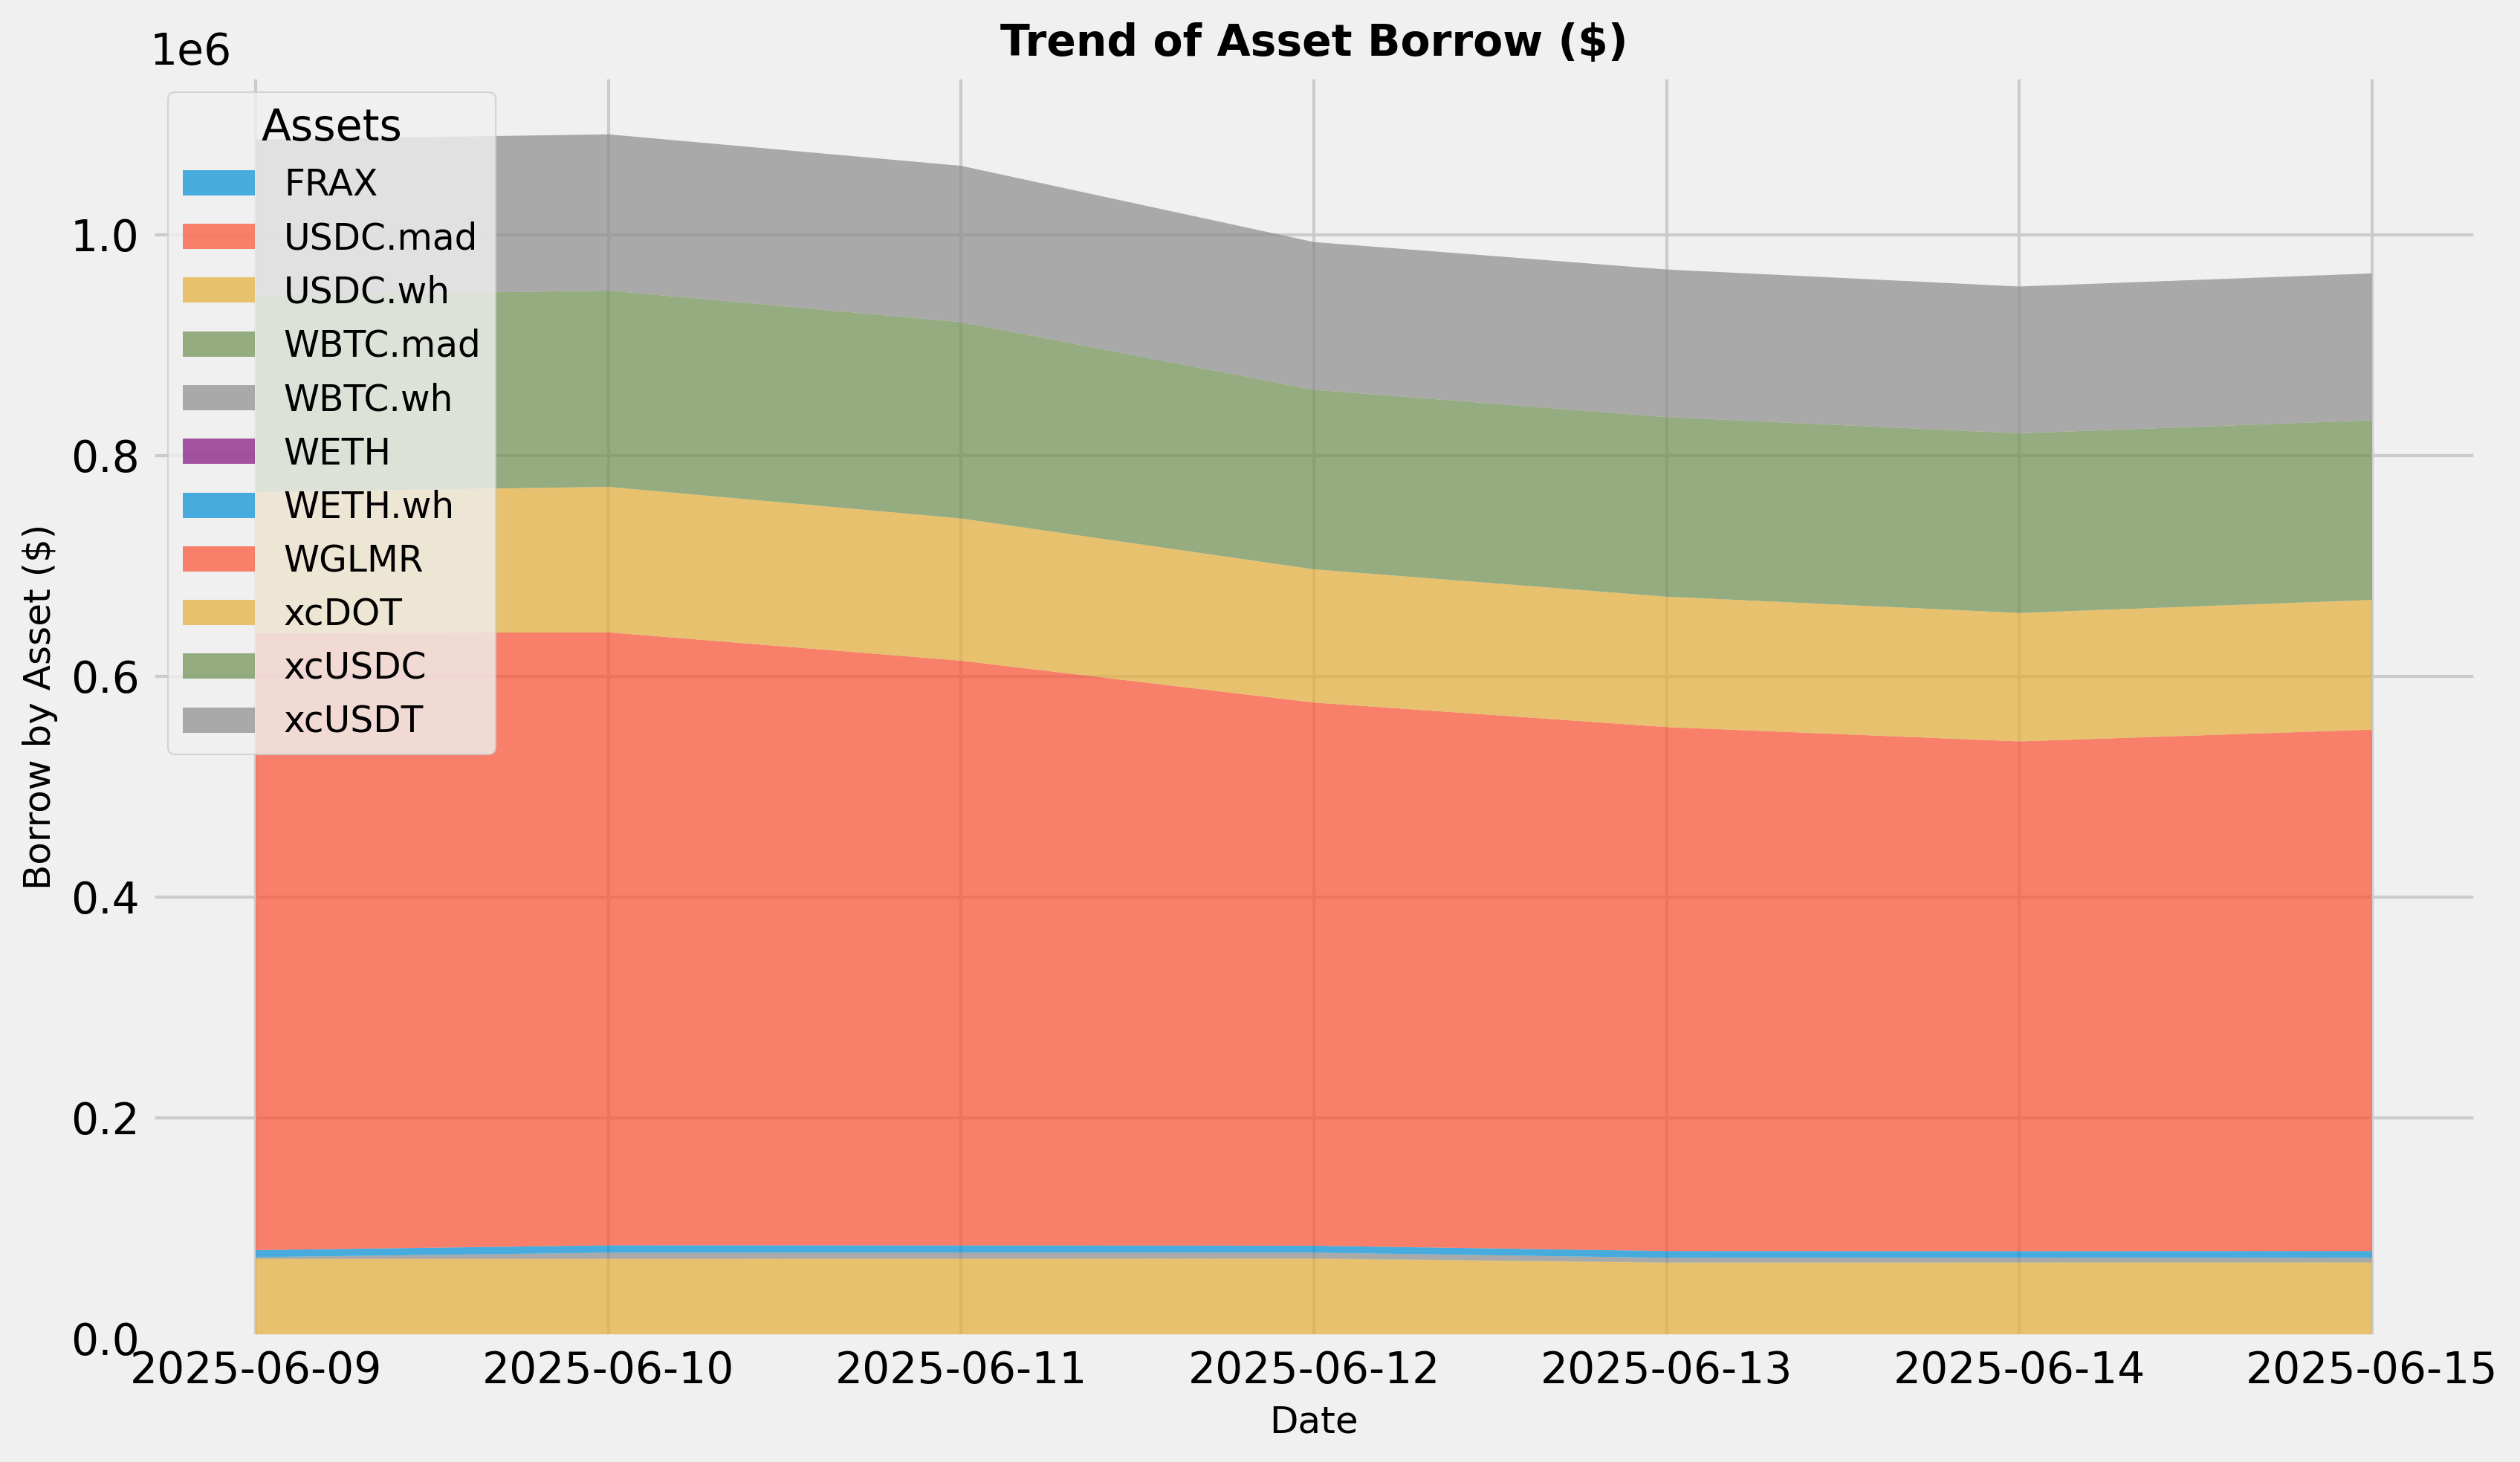
Borrows Trend
This graph shows the total borrows of all assets over the time frame in question. To see updated statistics, please see the live version of this graph here.
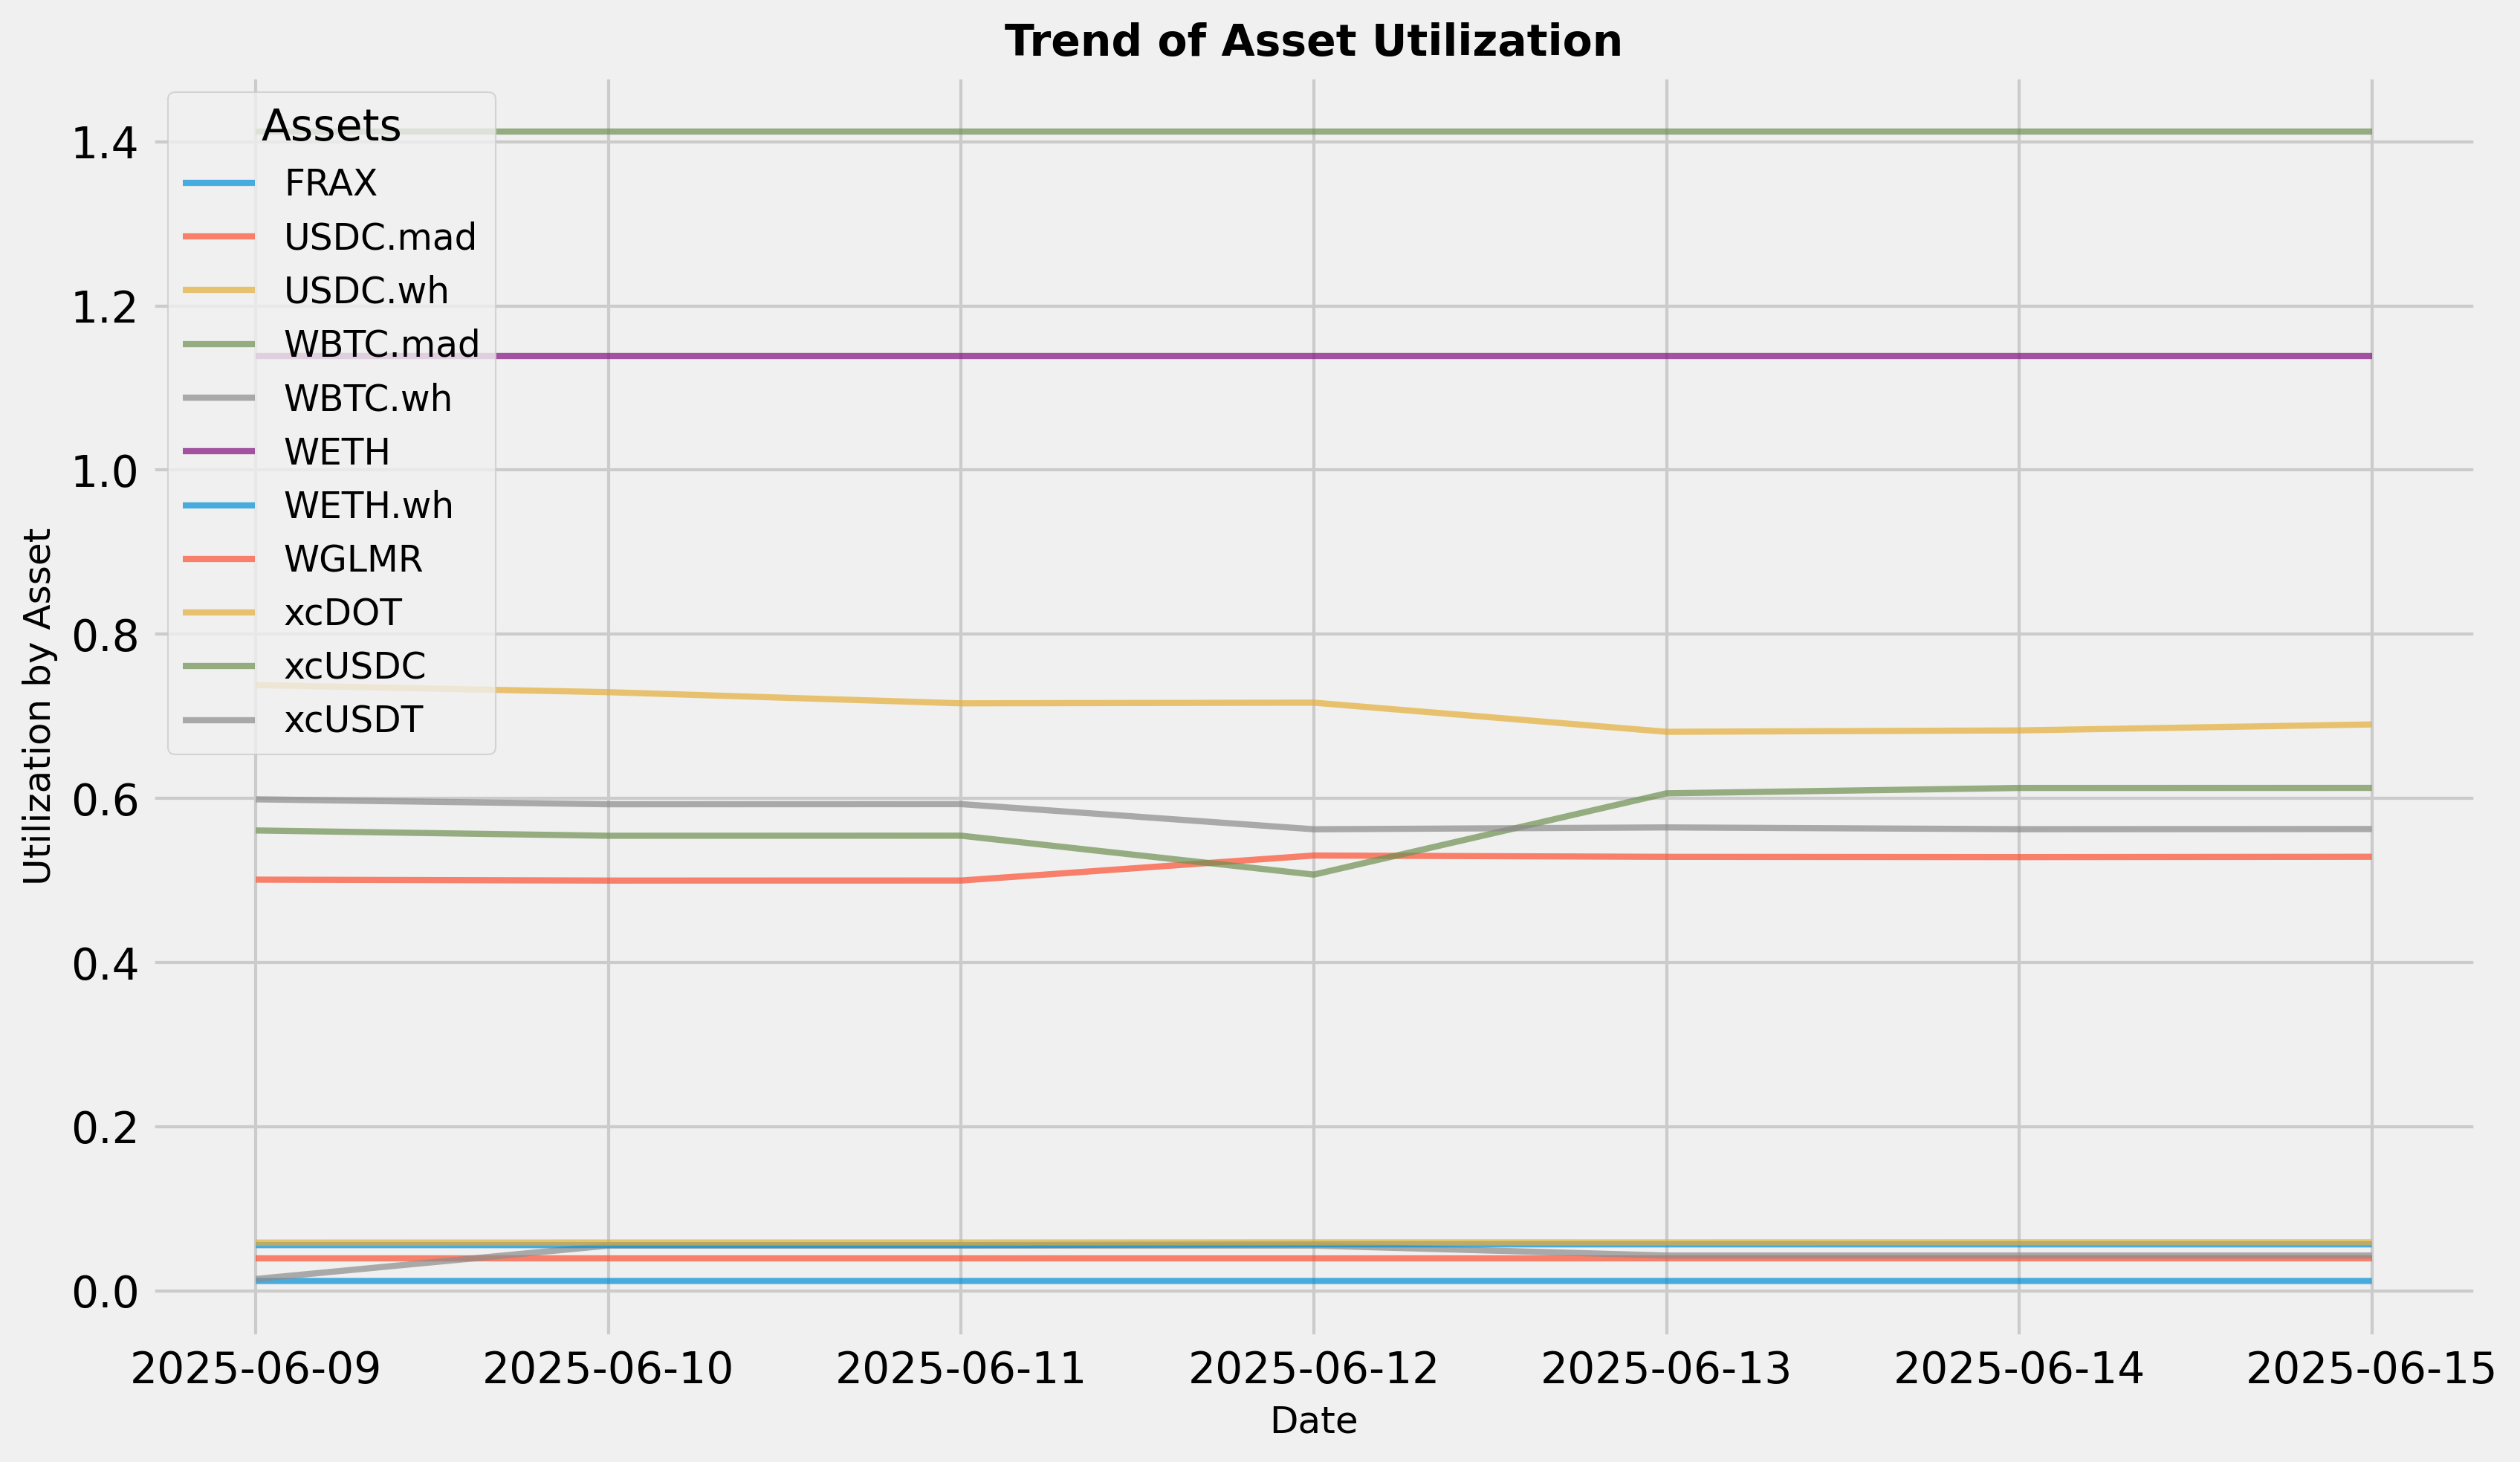
Utilization Trend
This graph shows the utilization (borrow / supply) of all assets over the time frame in question.
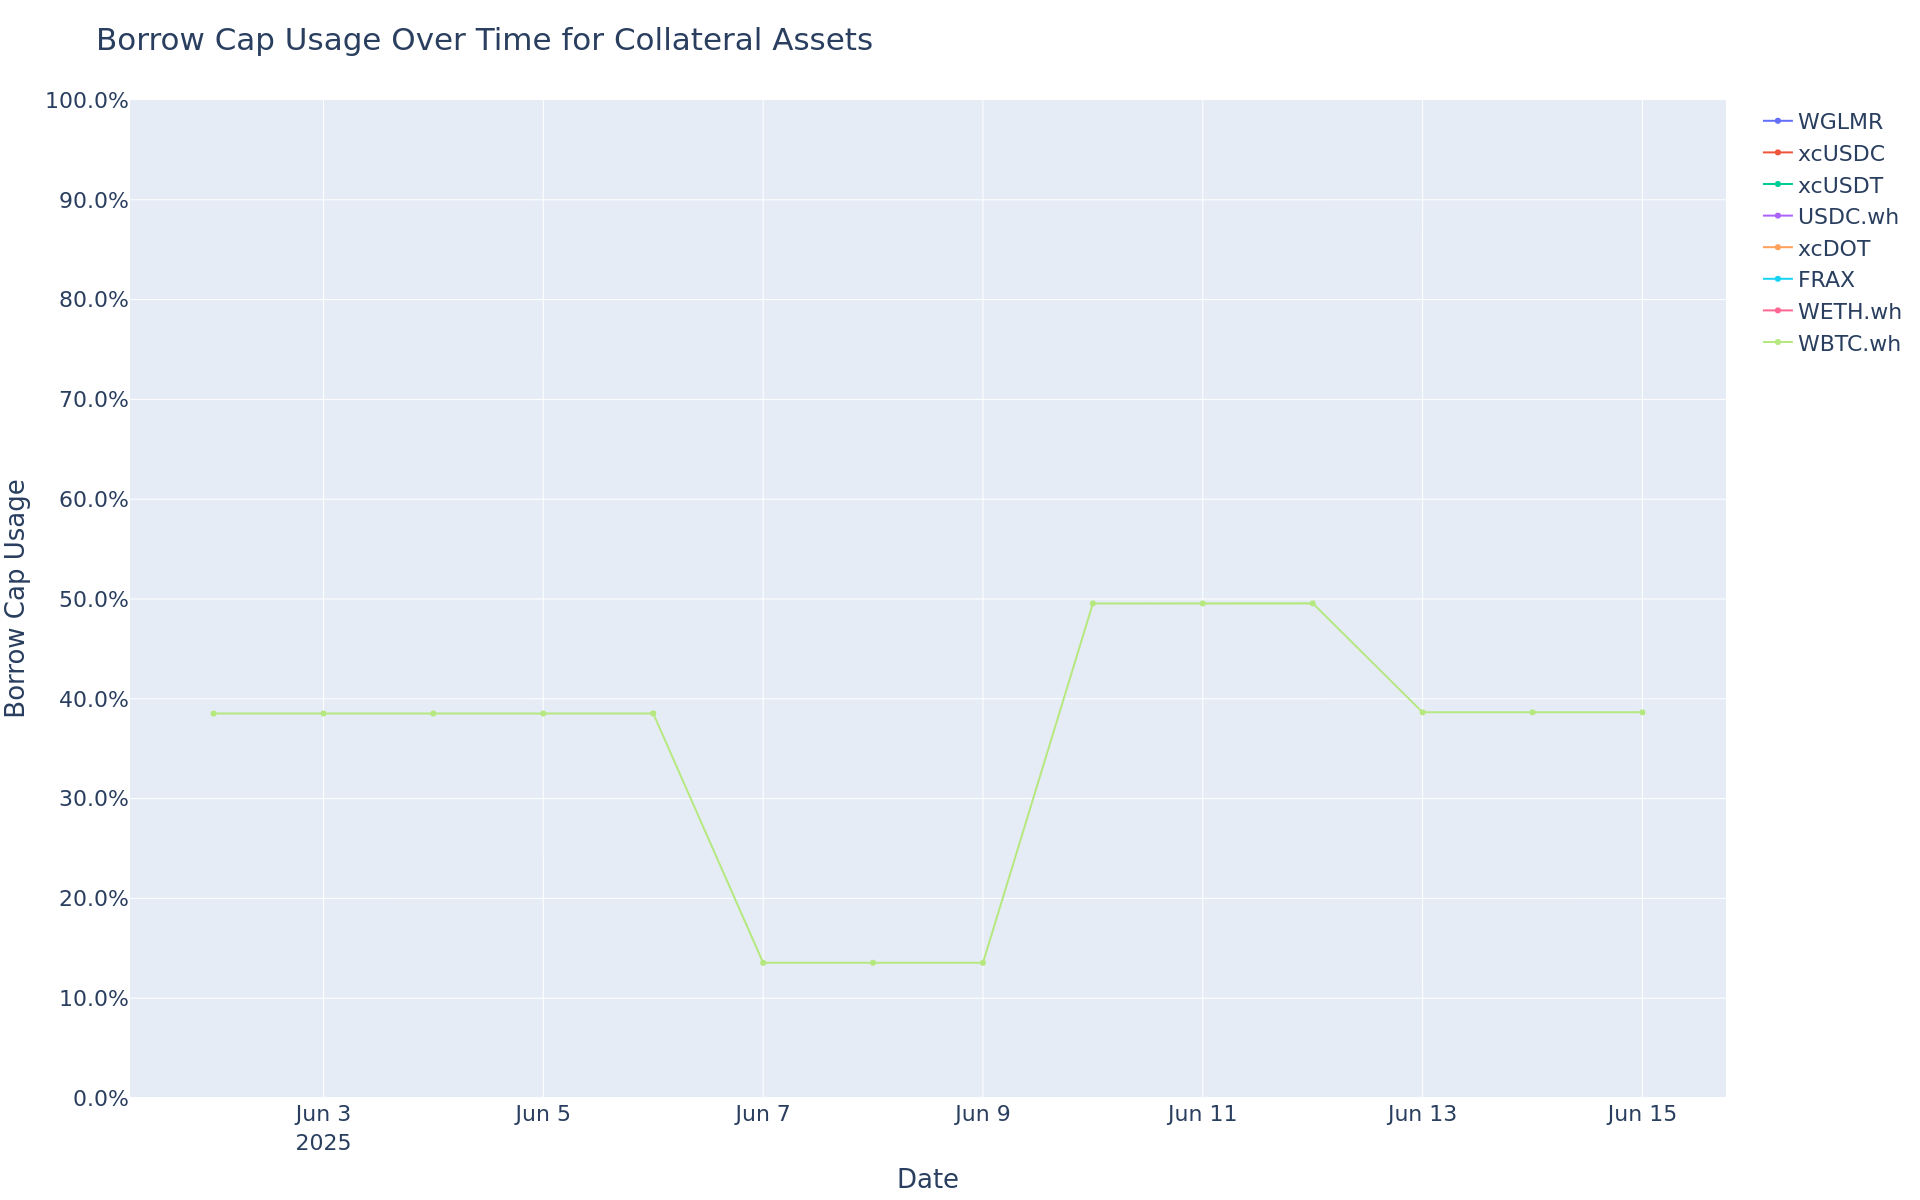
Borrow Cap Usage Trend
This graph shows the borrow cap usage (borrow / borrow cap) of all assets over the time frame in question.
Moonriver
Summary
This table gives high-level statistics over the time frame in question. Bold lines correspond to weekly utilization over 75%.
| Asset | Current Borrow Cap | Average Borrow Cap Usage (Past Week) | Average Supply Balance (Past Week) | Average Utilization | Current Global 2% Depth (USD) |
|---|---|---|---|---|---|
| WMOVR | 0.10 | 3.80M% | 127.18K | 2.99% | $198.89K |
| FRAX | 0.10 | 77.97M% | 105.21K | 74.11% | $16.59K |
Top Movers
- xcKSM’s borrow balance decreased WoW by 9% from $140K to $127K.
- xcKSM’s supply balance decreased WoW by 8% from $294K to $269K.
- xcKSM’s utilization decreased WoW by 1% from 47% to 47%.
- No asset has supply or borrow cap usage above 75%.
Liquidations
| Liquidated Asset | Liquidated Amount (Tokens) | Liquidated Amount (USD) |
|---|---|---|
| mUSDC | 21.96 | $21.95 |
| mUSDT | 9.12 | $9.12 |
| mWBTC | 0.00 | $2.02 |
| mMOVR | 0.09 | $0.52 |
| mETH | 0.00 | $0.50 |
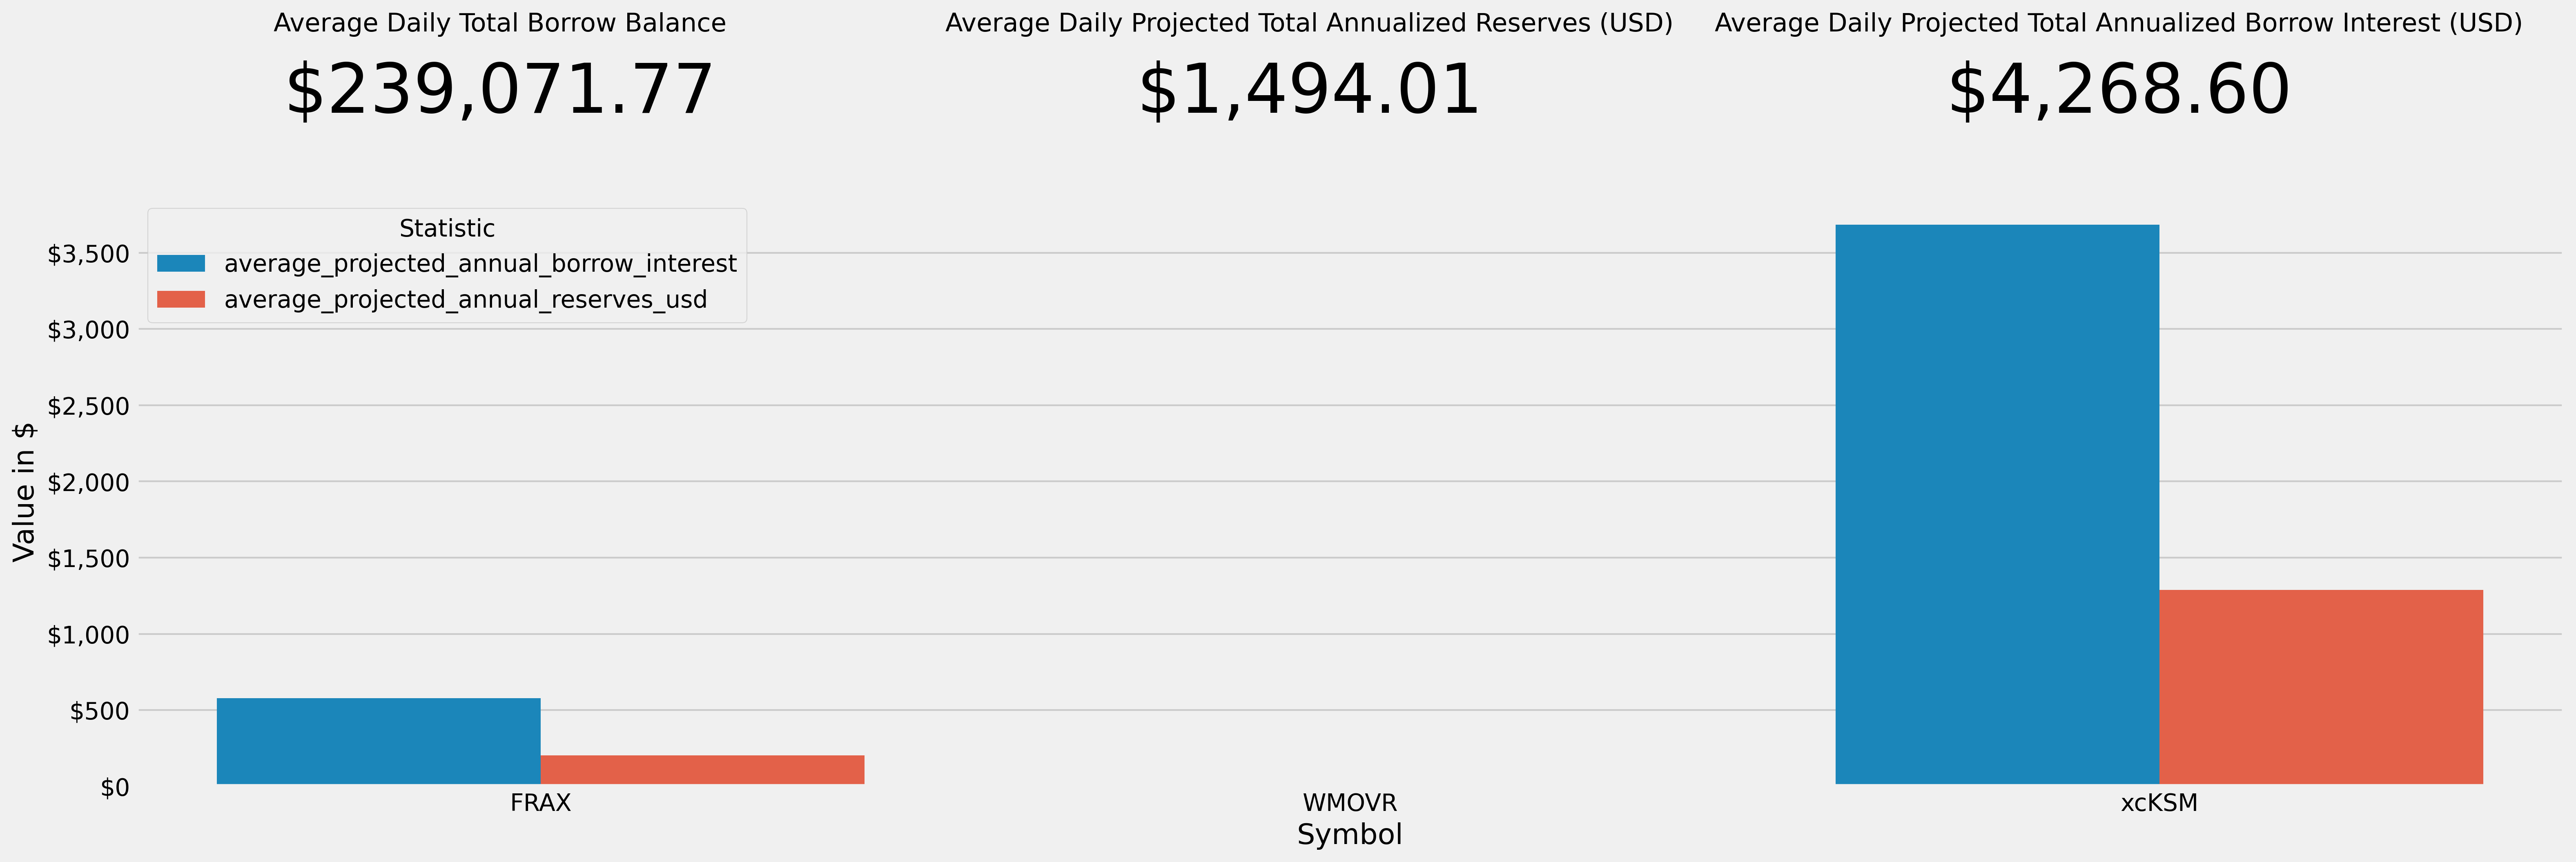
Weekly Annualized Reserve and Interest Projections
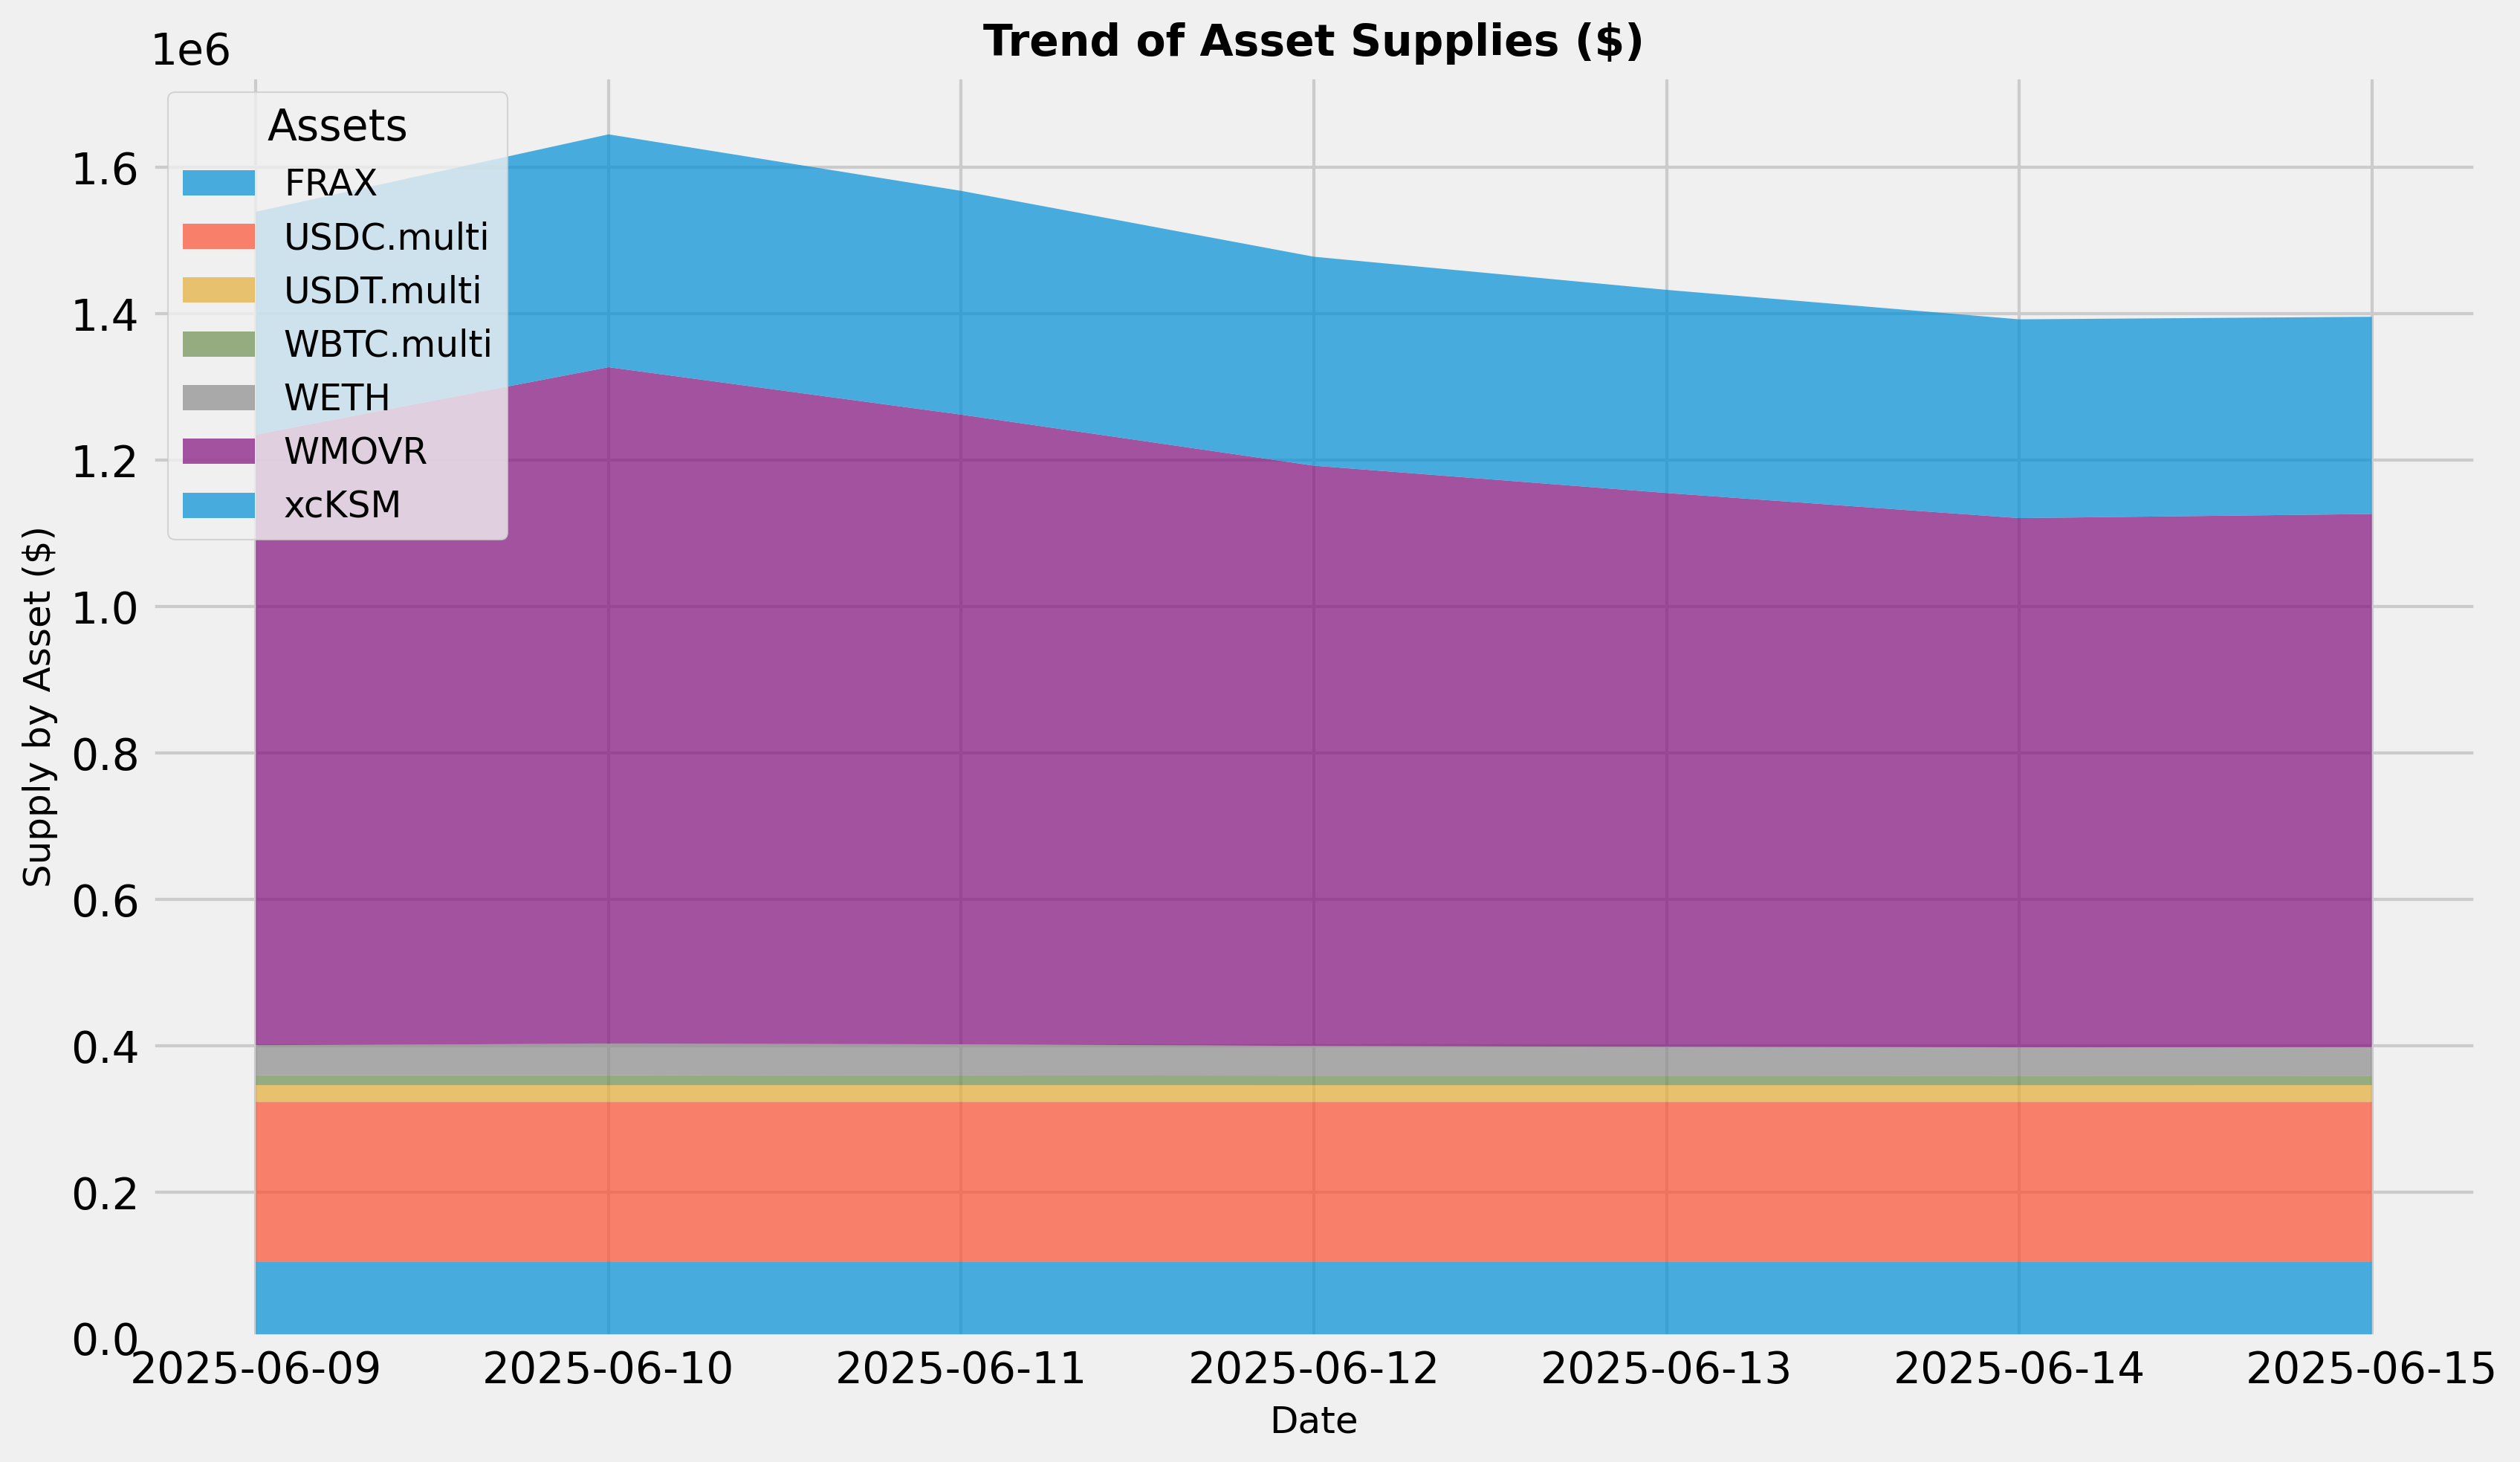
Supply Trend
This graph shows the total supply of all assets over the time frame in question. To see updated statistics, please see the live version of this graph here.
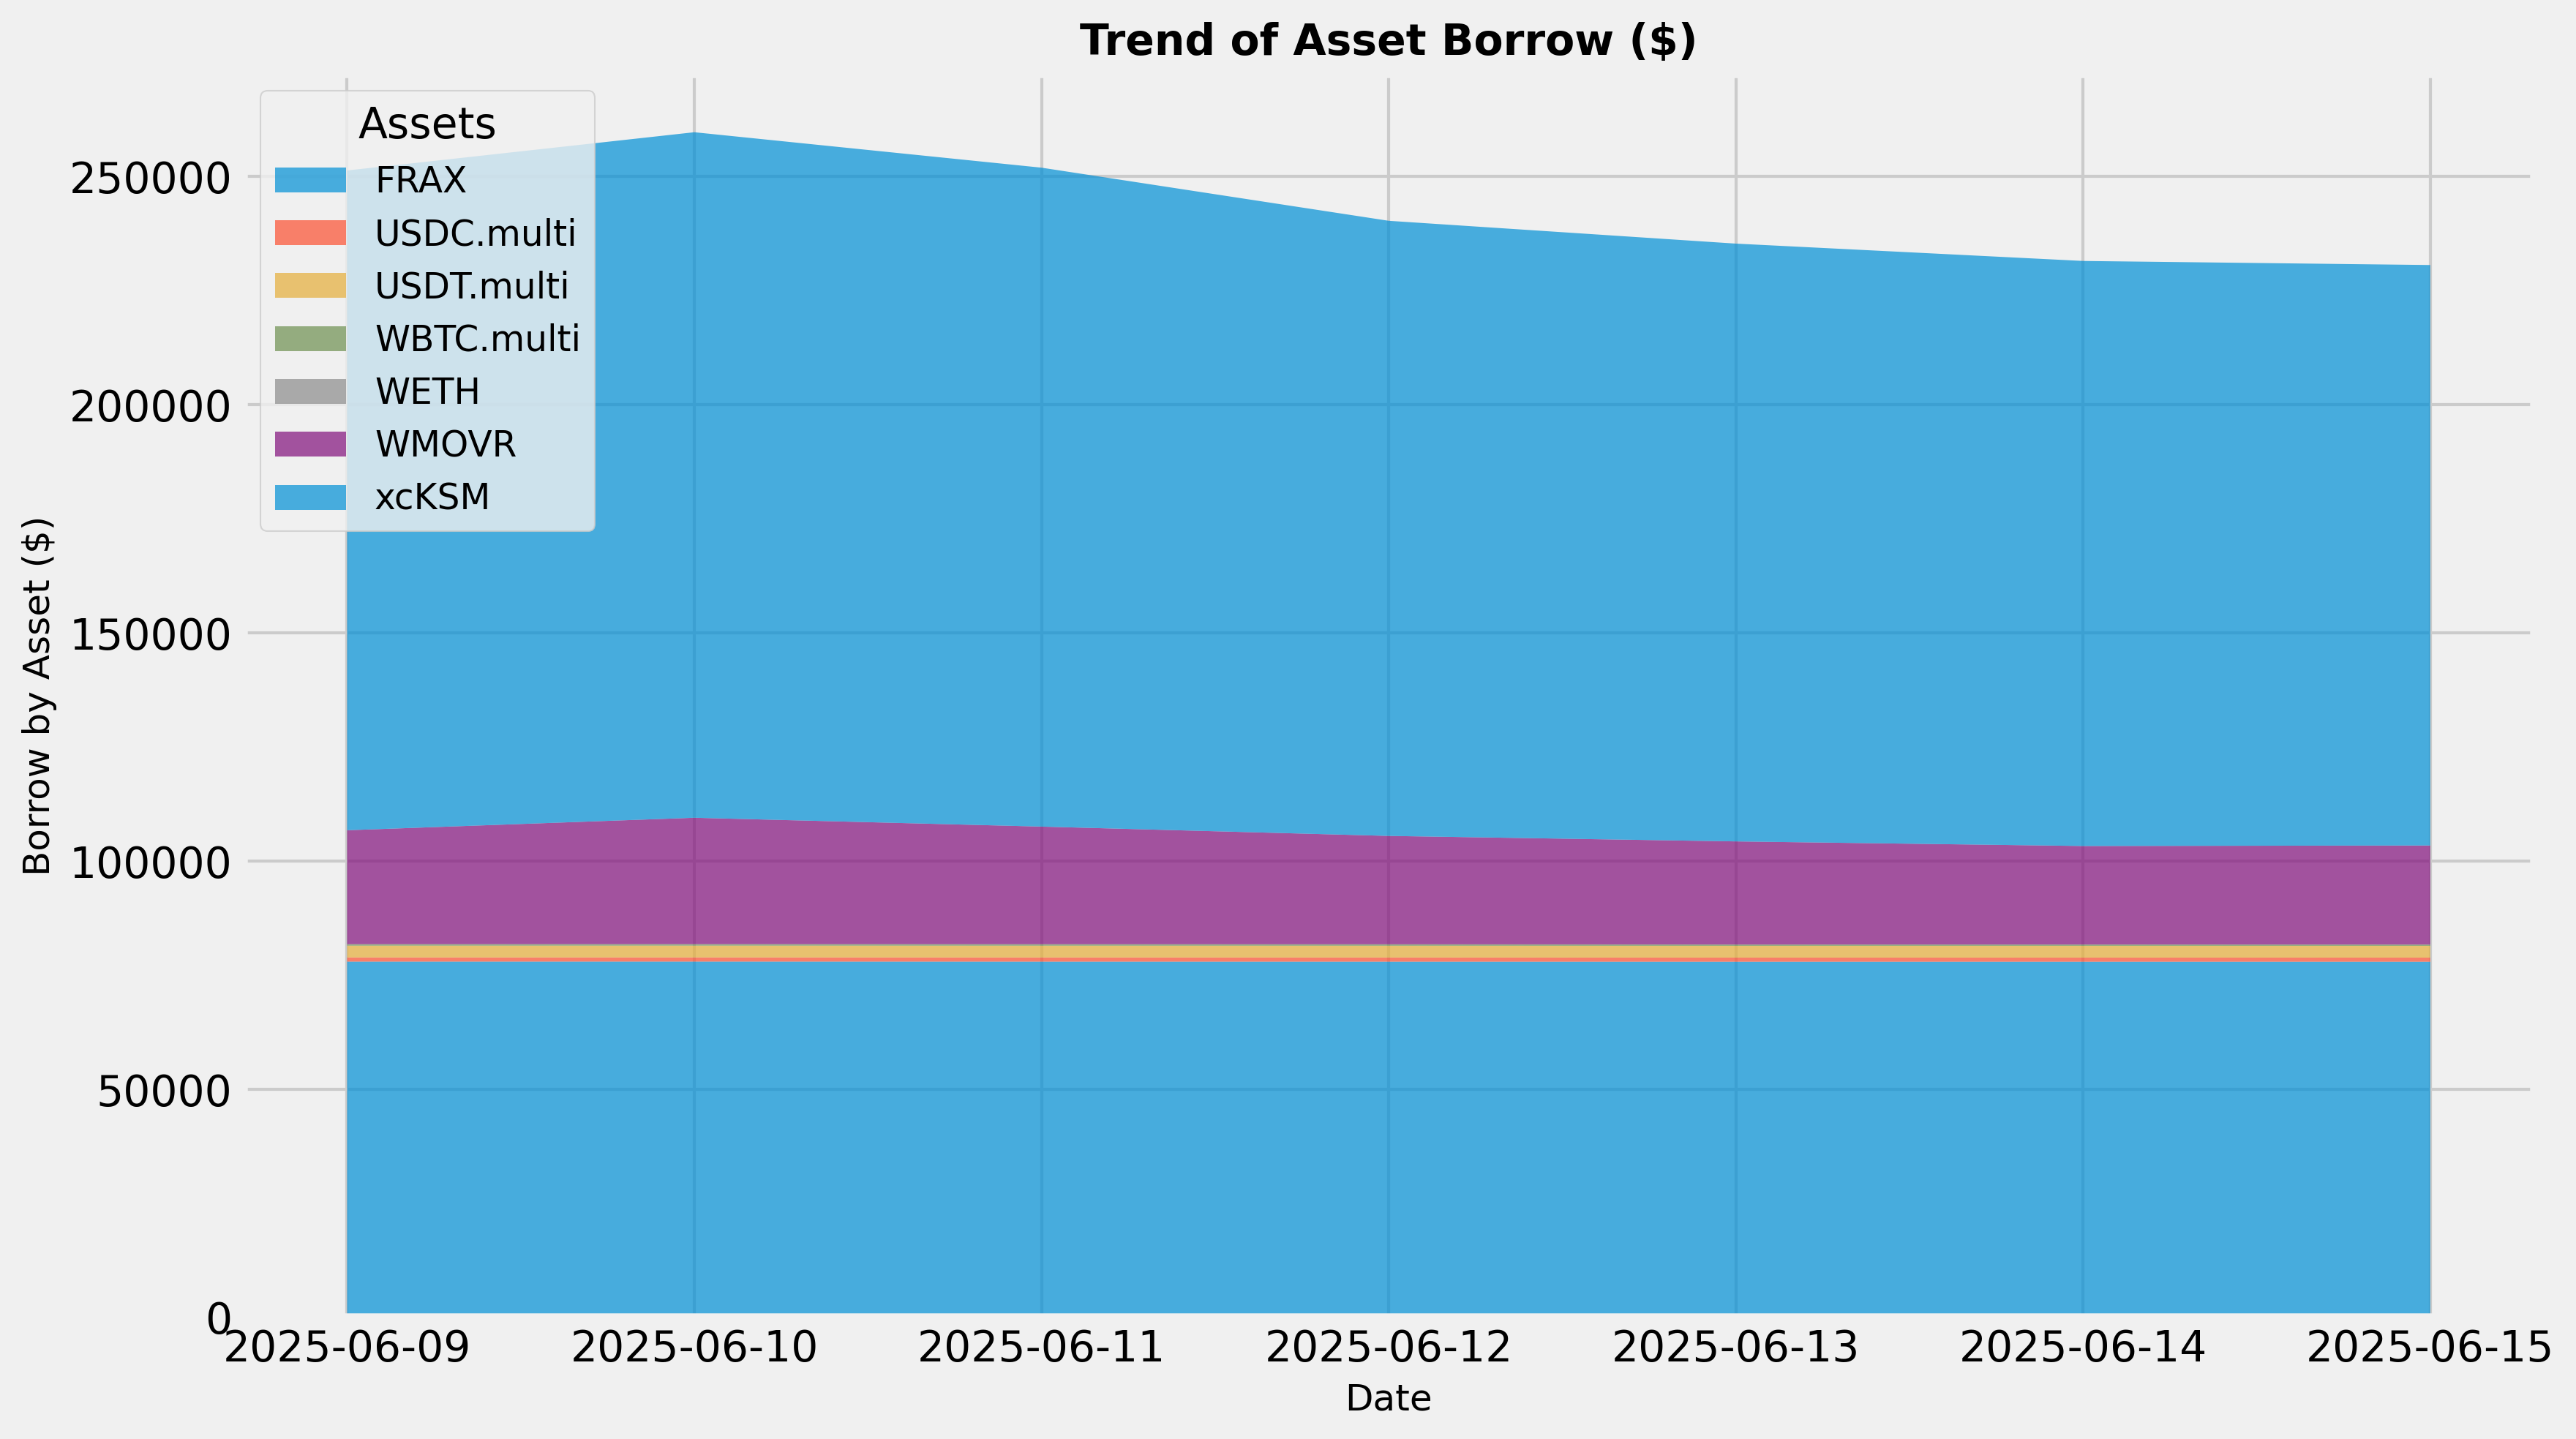
Borrows Trend
This graph shows the total borrows of all assets over the time frame in question. To see updated statistics, please see the live version of this graph here.
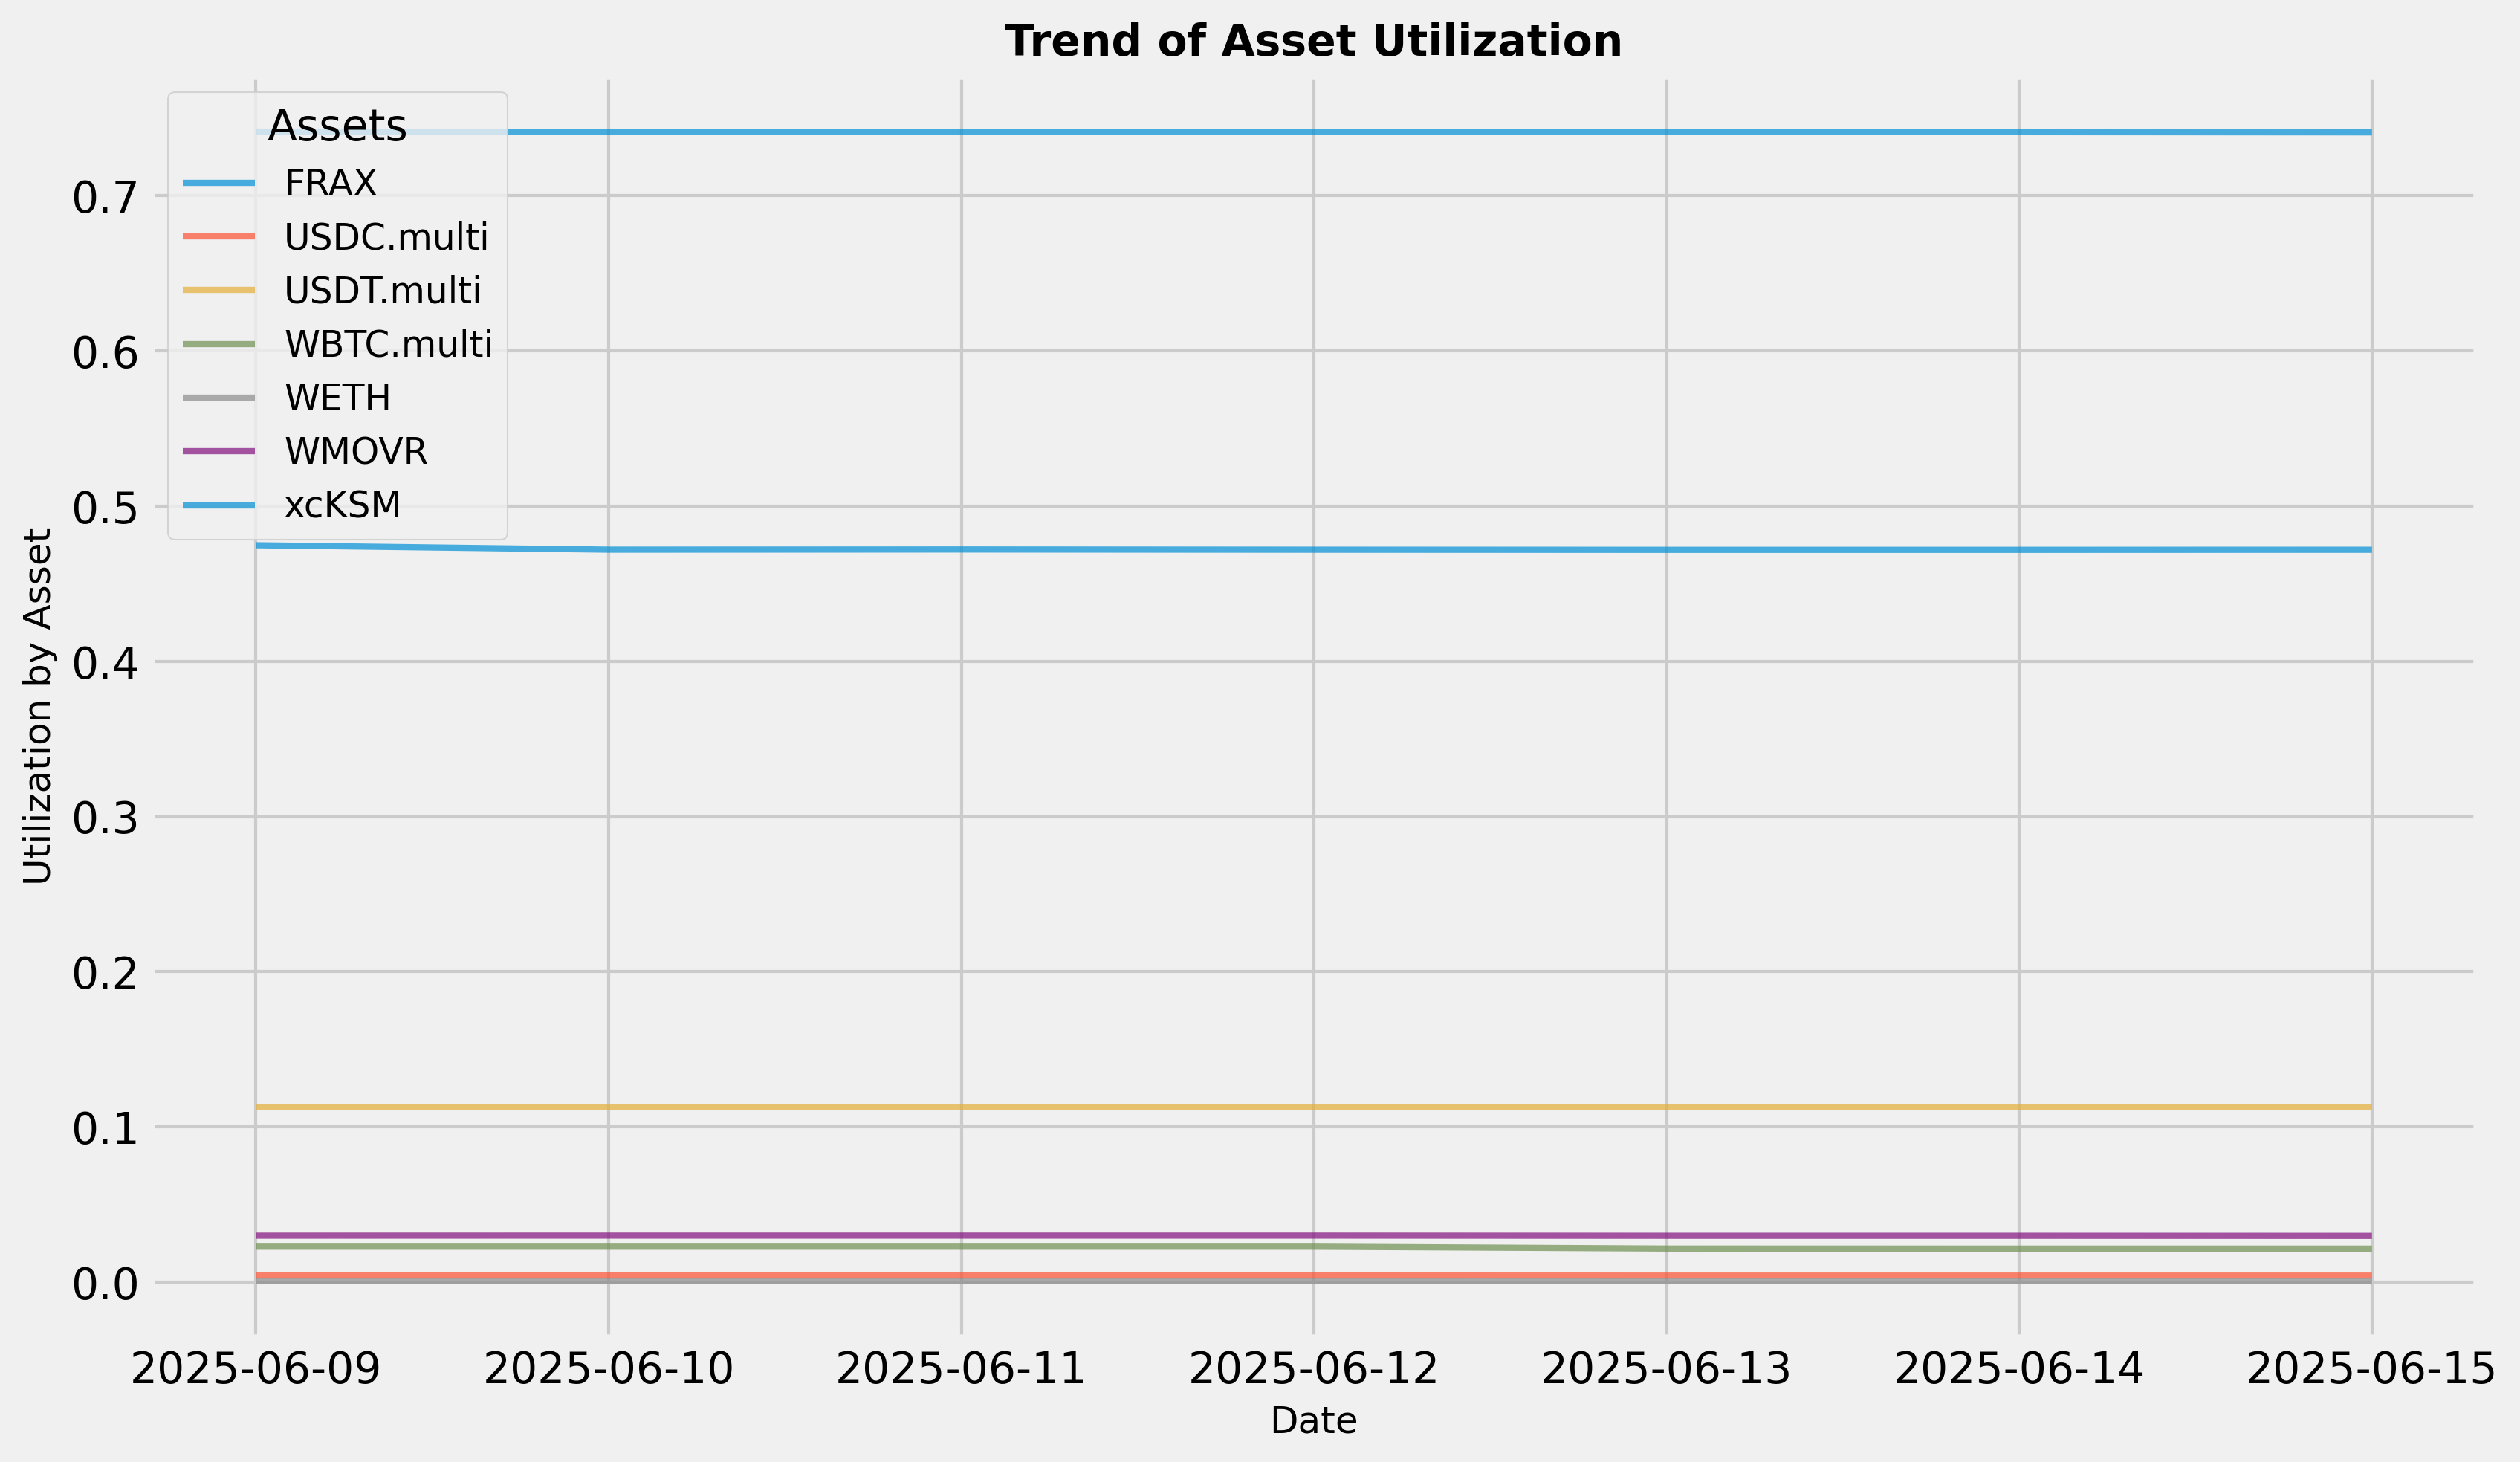
Utilization Trend
This graph shows the utilization (borrow / supply) of all assets over the time frame in question.
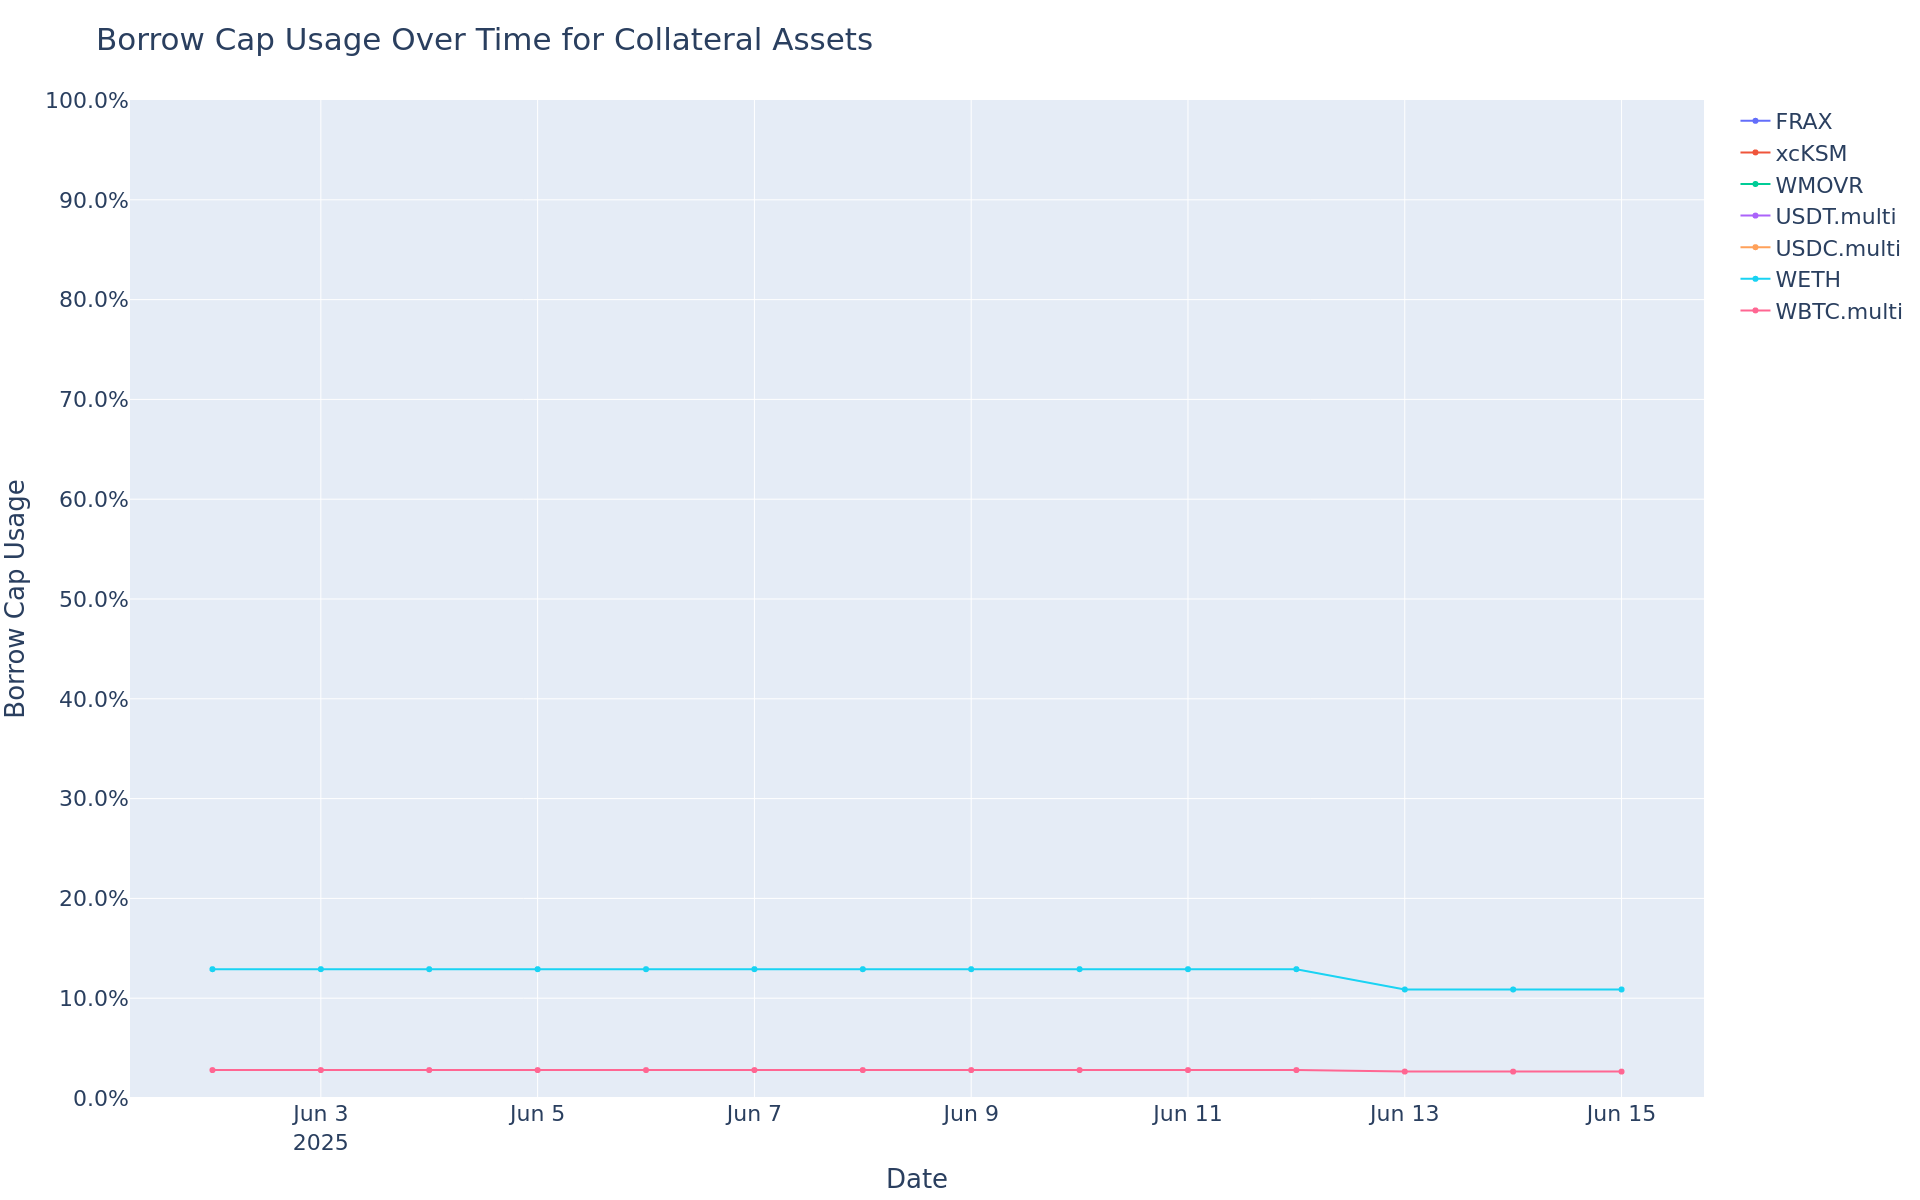
Borrow Cap Usage Trend
This graph shows the borrow cap usage (borrow / borrow cap) of all assets over the time frame in question.