[Gauntlet] Weekly Market Update - (2025-06-16 through 2025-06-22)
Base
Gauntlet would like to provide the community with an update on this market over the previous week. Gauntlet is continuing to monitor this market.
Summary
This table gives high-level statistics over the time frame in question. Bold lines correspond to weekly average supply/borrow cap usage over 75%.
| Asset | Current Borrow Cap | Current Supply Cap | Average Borrow Cap Usage (Past Week) | Average Supply Cap Usage (Past Week) | Average Utilization | Current DEX 25% Slippage (USD) |
|---|---|---|---|---|---|---|
| USDC | 184.00M | 200.00M | 43.82% | 44.91% | 89.77% | $511.81K |
| WELL | 75.00M | 150.00M | 42.63% | 65.29% | 32.65% | $1.88M |
| AERO | 25.00M | 70.00M | 26.16% | 36.87% | 25.34% | $11.38M |
| EURC | 21.00M | 21.90M | 18.01% | 24.58% | 70.26% | $596.40K |
| VIRTUAL | 2.30M | 4.50M | 33.53% | 29.23% | 58.63% | $2.98M |
| MORPHO | 1.00M | 4.00M | 50.87% | 61.66% | 20.62% | $210.38K |
| USDS | 690.00K | 750.00K | 1.32% | 1.52% | 80.10% | $60.45K |
| DAI | 300.00K | 400.00K | 6.52% | 7.99% | 61.18% | $63.03K |
| WETH | 64.00K | 96.00K | 40.72% | 31.90% | 85.08% | $14.55M |
| cbETH | 6.40K | 16.00K | 1.43% | 18.08% | 3.16% | $1.52M |
| wstETH | 4.80K | 14.40K | 3.15% | 32.10% | 3.27% | $365.05K |
| rETH | 900.00 | 2.60K | 2.70% | 49.80% | 1.87% | $2.49M |
| weETH | 700.00 | 4.00K | 4.72% | 49.85% | 1.66% | $1.17M |
| cbBTC | 640.00 | 1.50K | 17.95% | 47.73% | 16.05% | $12.81M |
| wrsETH | 430.00 | 1.00K | 0.13% | 28.69% | 0.19% | $29.59K |
| LBTC | 38.00 | 95.00 | 27.53% | 48.54% | 22.68% | $60.86K |
| tBTC | 36.00 | 90.00 | 9.08% | 14.45% | 25.12% | $1.14M |
| USDbC | 1.00 | 1.00 | 155.03K% | 1.35M% | 11.46% | $888.53K |
Top Movers
- cbETH’s borrow balance increased WoW by 122% from $157K to $348K.
- wstETH’s borrow balance decreased WoW by 64% from $621K to $220K.
- EURC’s supply balance increased WoW by 27% from $5M to $6M.
- VIRTUAL’s supply balance decreased WoW by 31% from $2M to $2M.
- cbETH’s utilization increased WoW by 159% from 2% to 5%.
- wstETH’s utilization decreased WoW by 62% from 5% to 2%.
Liquidations
| Liquidated Asset | Liquidated Amount (Tokens) | Liquidated Amount (USD) |
|---|---|---|
| mUSDC | 144.24K | $144.24K |
| mAERO | 170.24K | $133.31K |
| mcbBTC | 0.43 | $42.47K |
| mWETH | 8.99 | $20.88K |
| mWELL | 141.40K | $3.93K |
| mVIRTUAL | 2.01K | $2.83K |
| mcbETH | 1.04 | $2.73K |
| mLBTC | 0.00 | $157.10 |
| mMORPHO | 46.79 | $54.78 |
| mwstETH | 0.02 | $45.58 |
| mweETH | 0.00 | $2.86 |
Weekly Annualized Reserve and Interest Projections

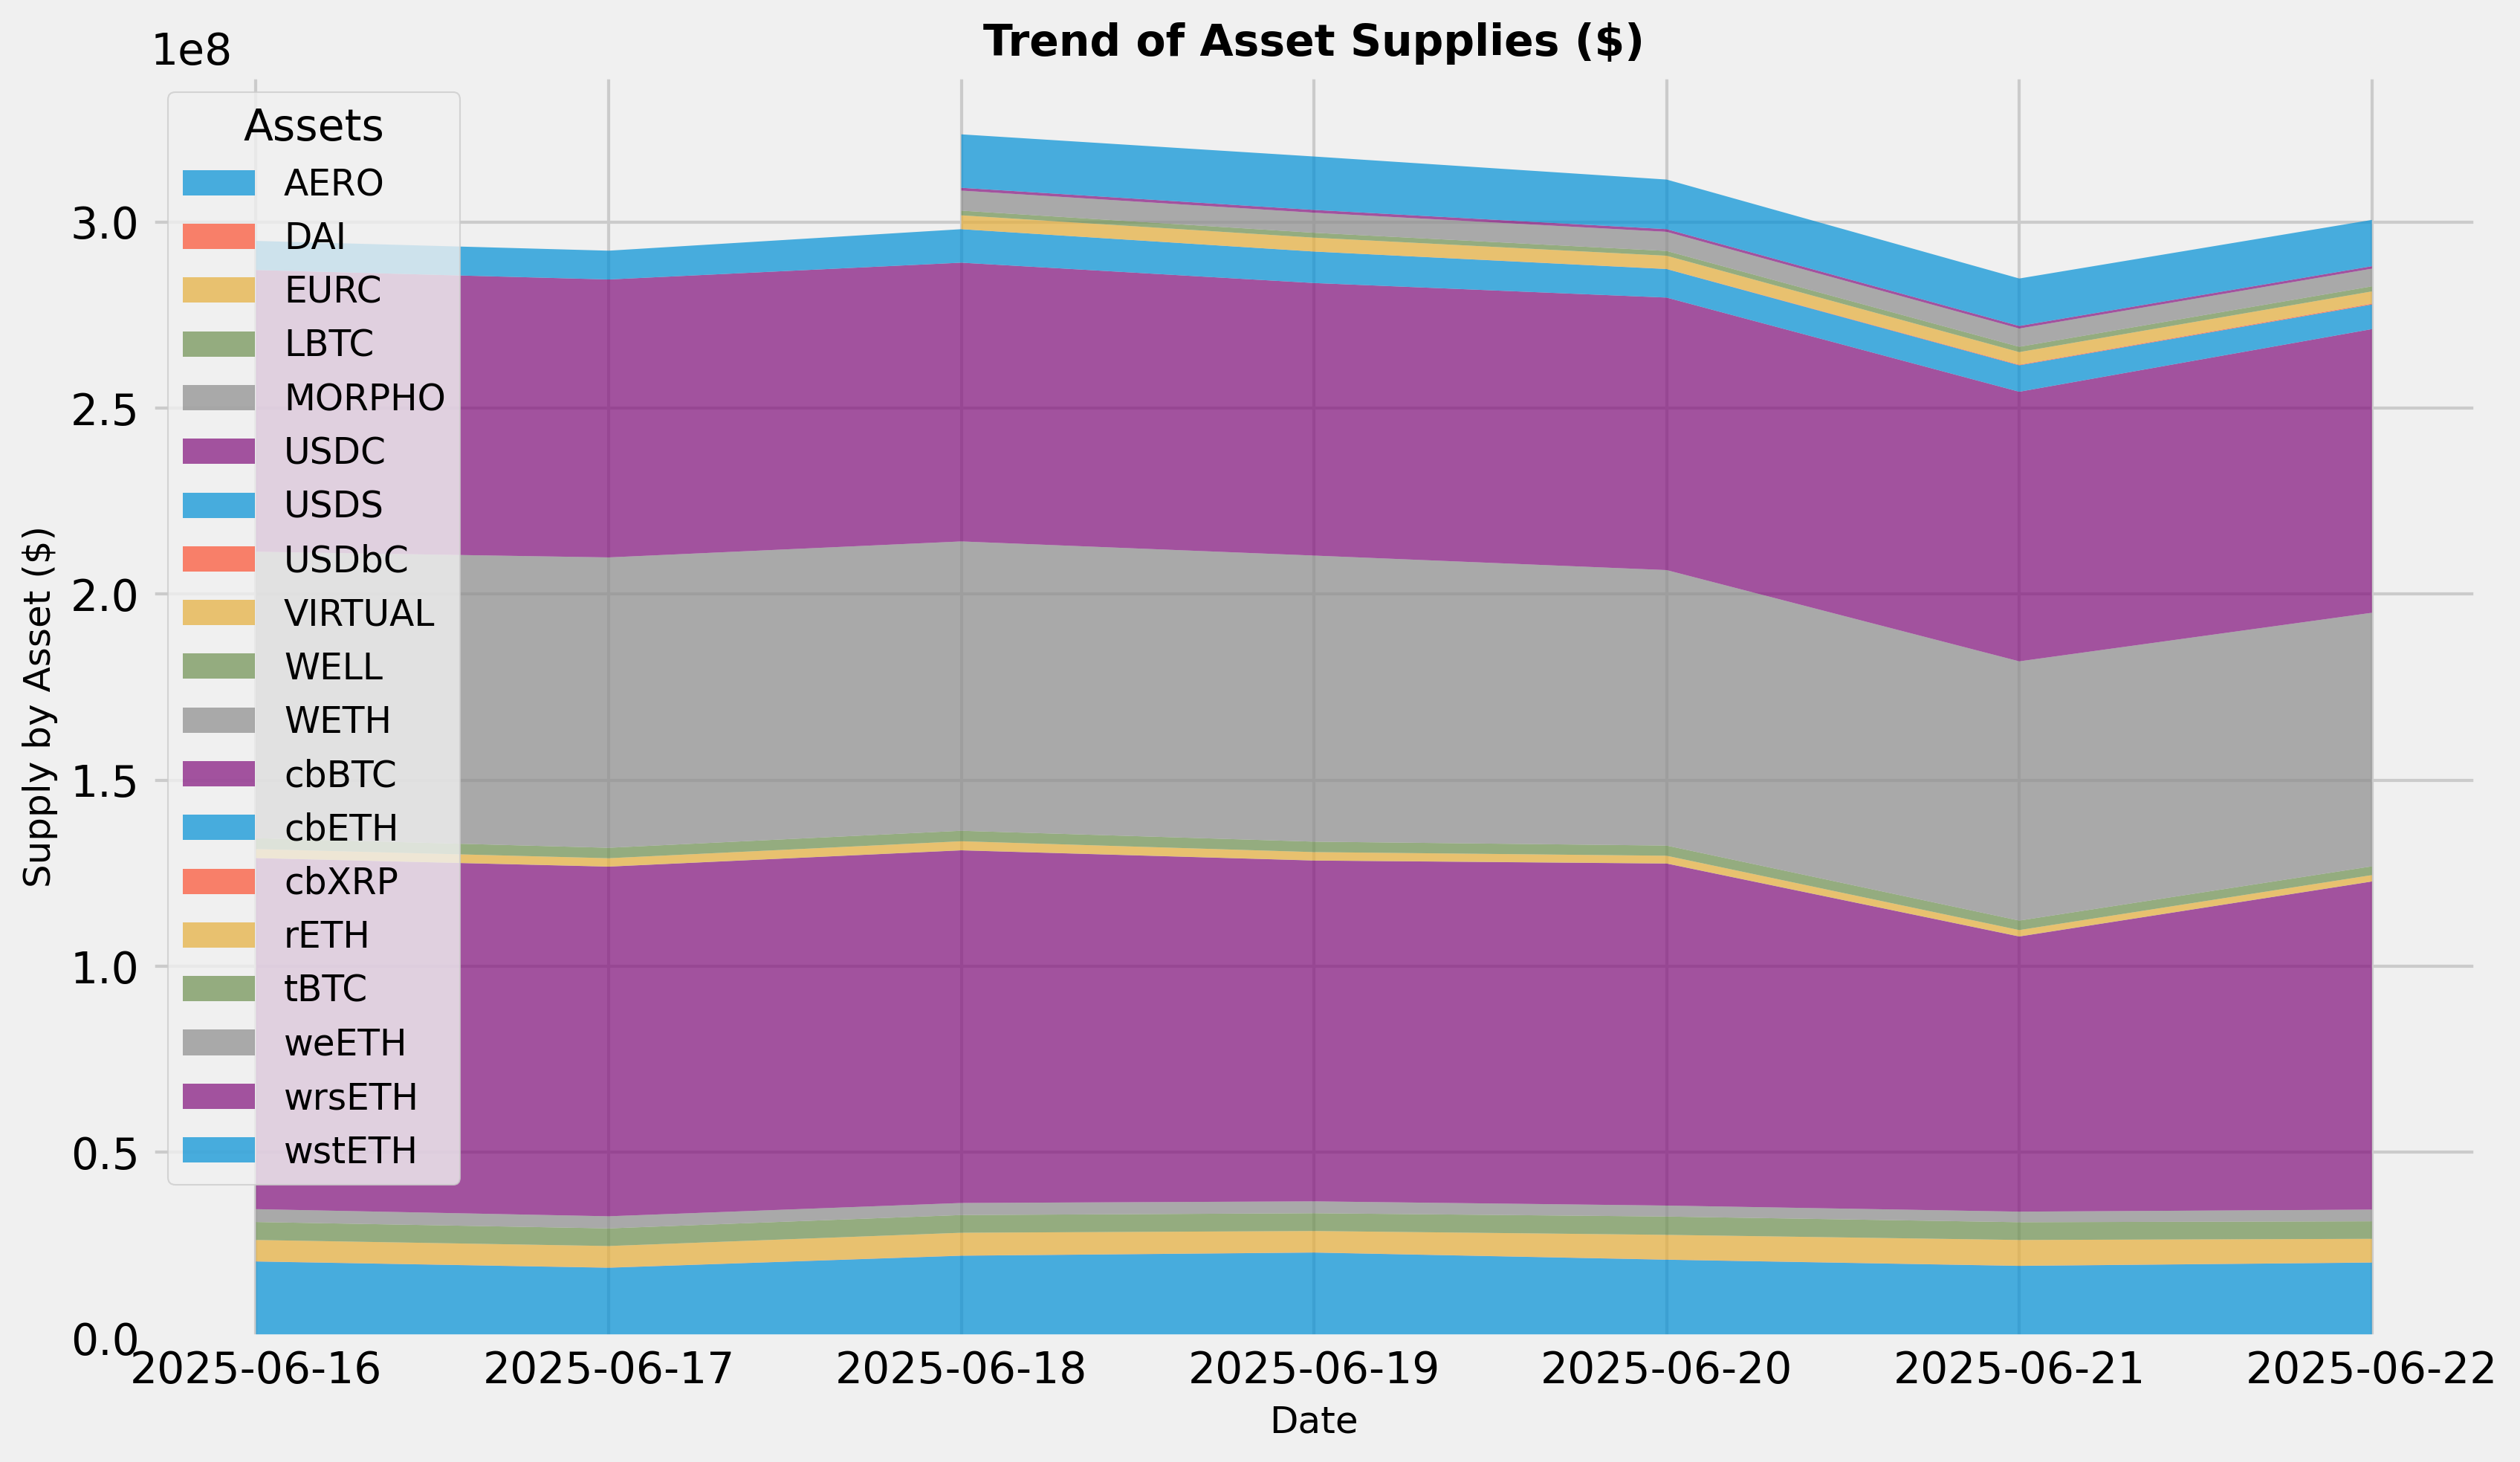
Supply Trend
This graph shows the total supply of all assets over the time frame in question. To see updated statistics, please see the live version of this graph here.
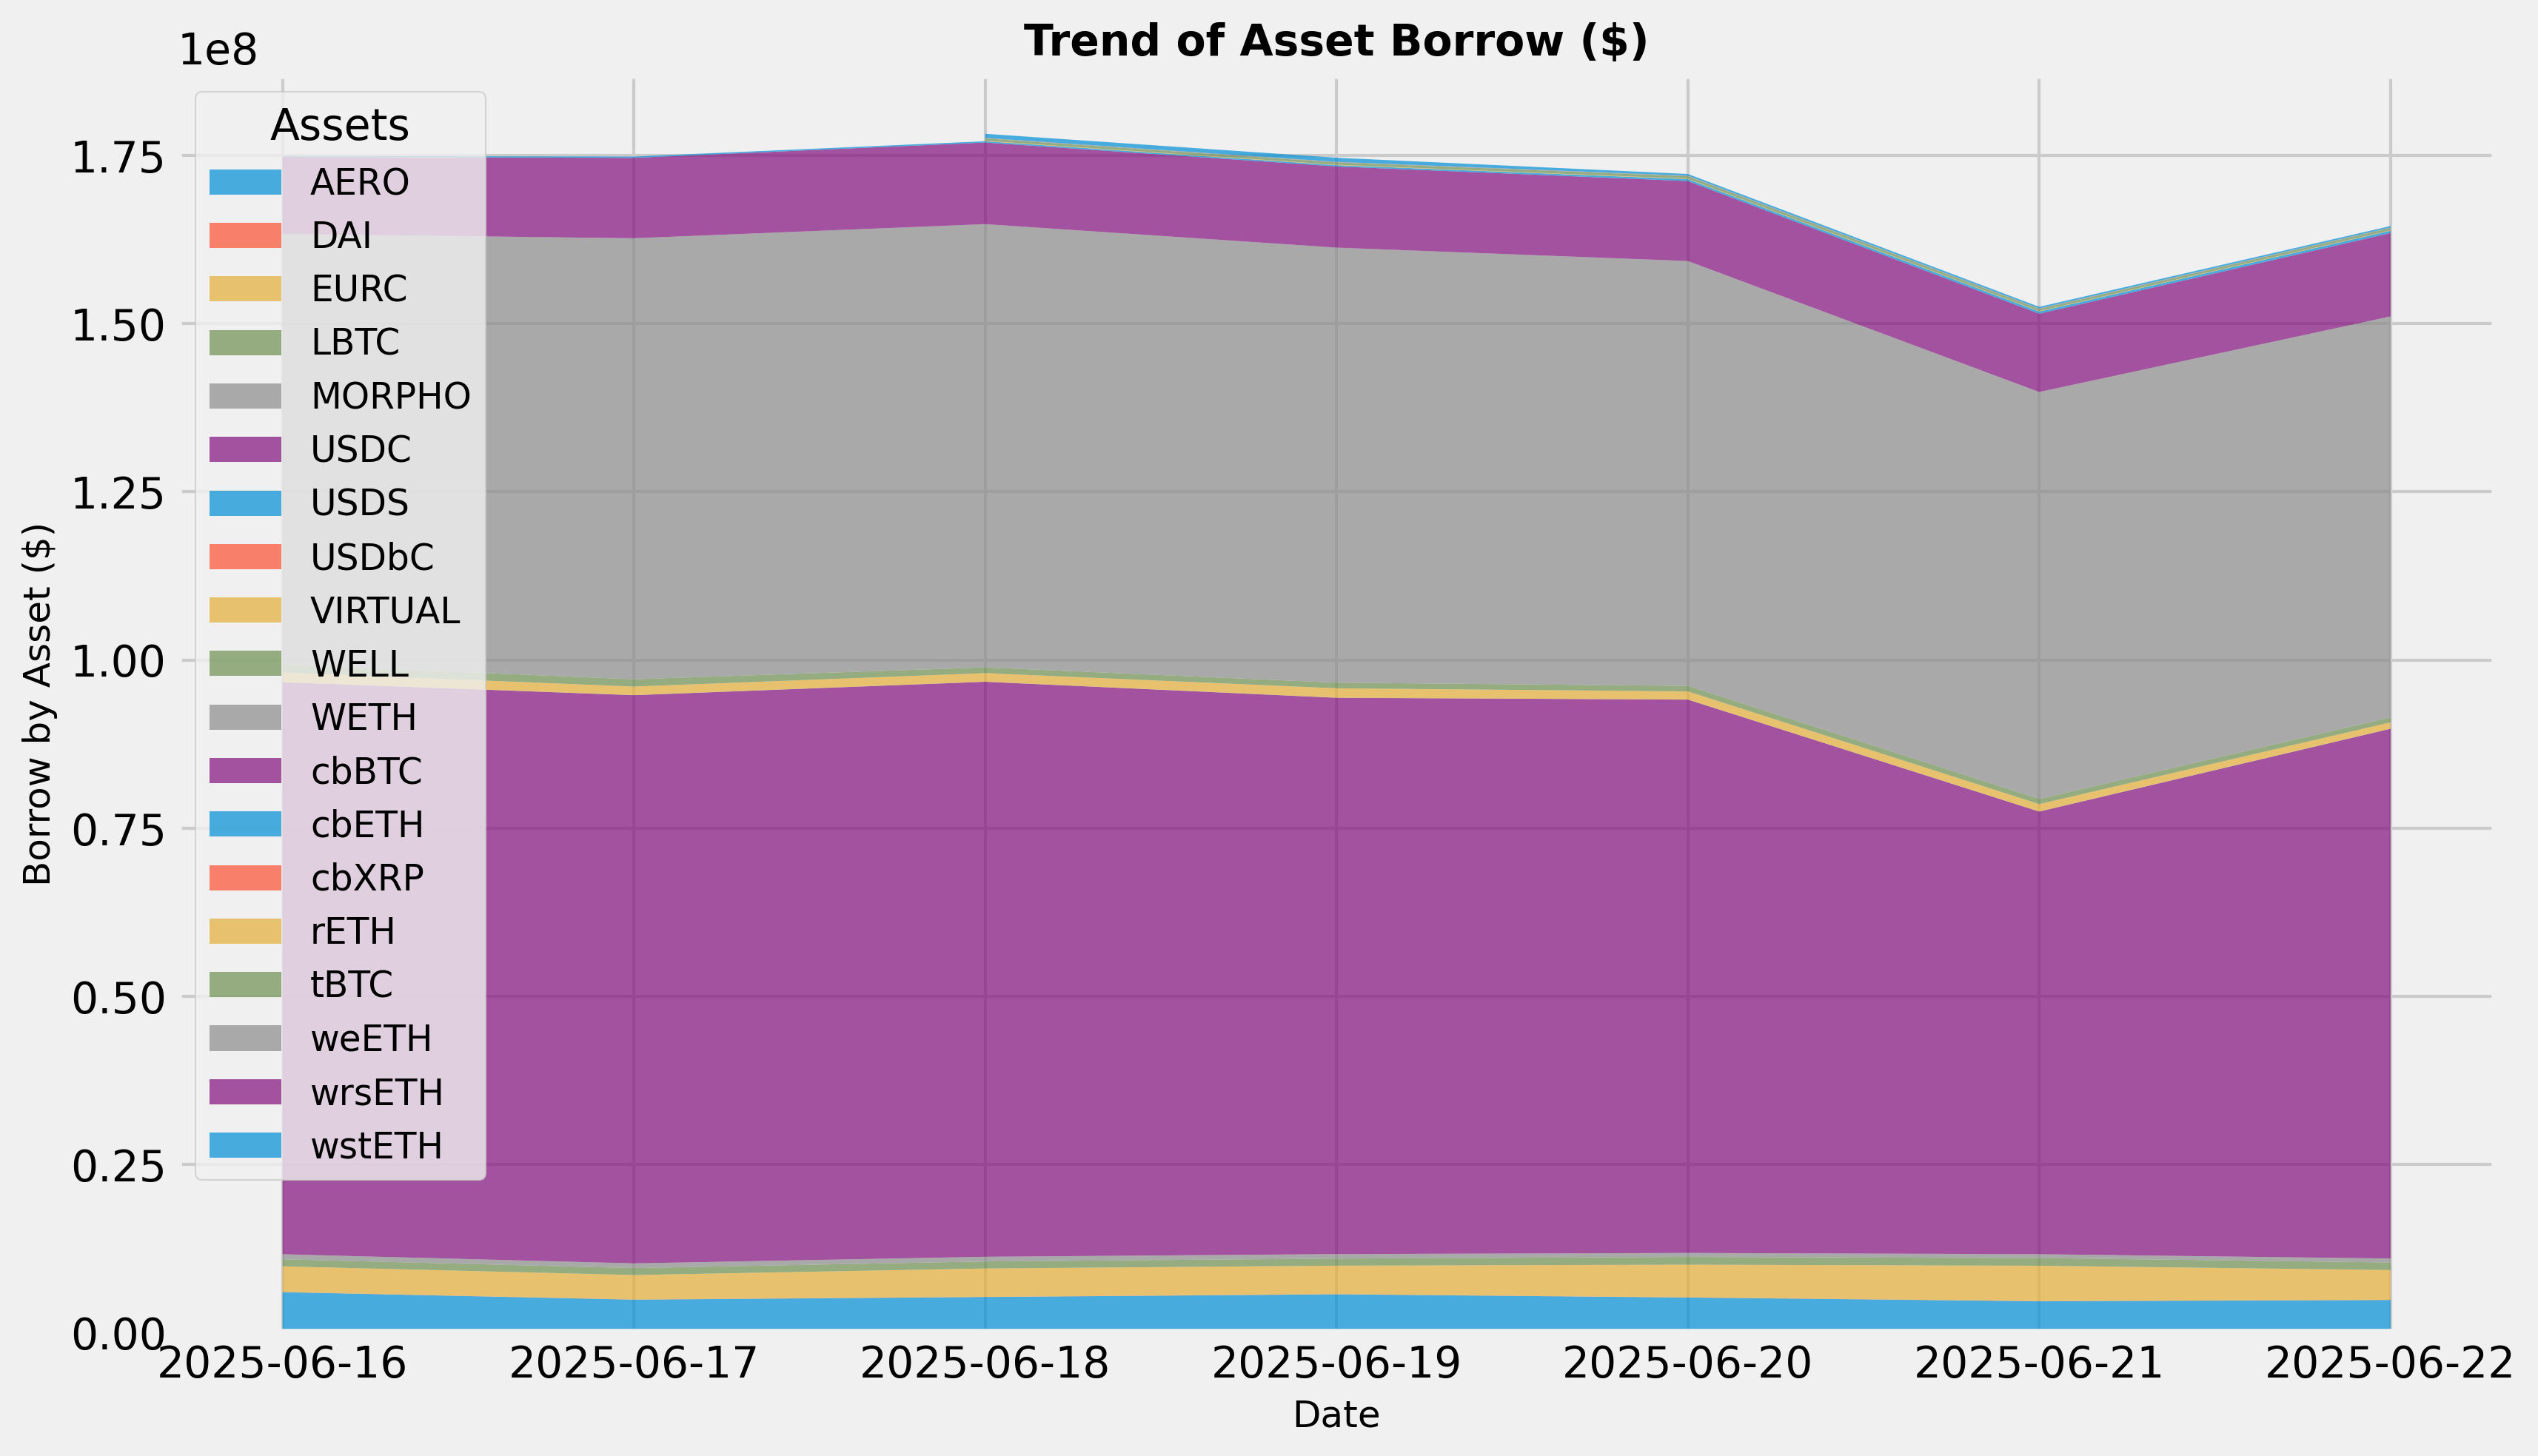
Borrows Trend
This graph shows the total borrows of all assets over the time frame in question. To see updated statistics, please see the live version of this graph here.
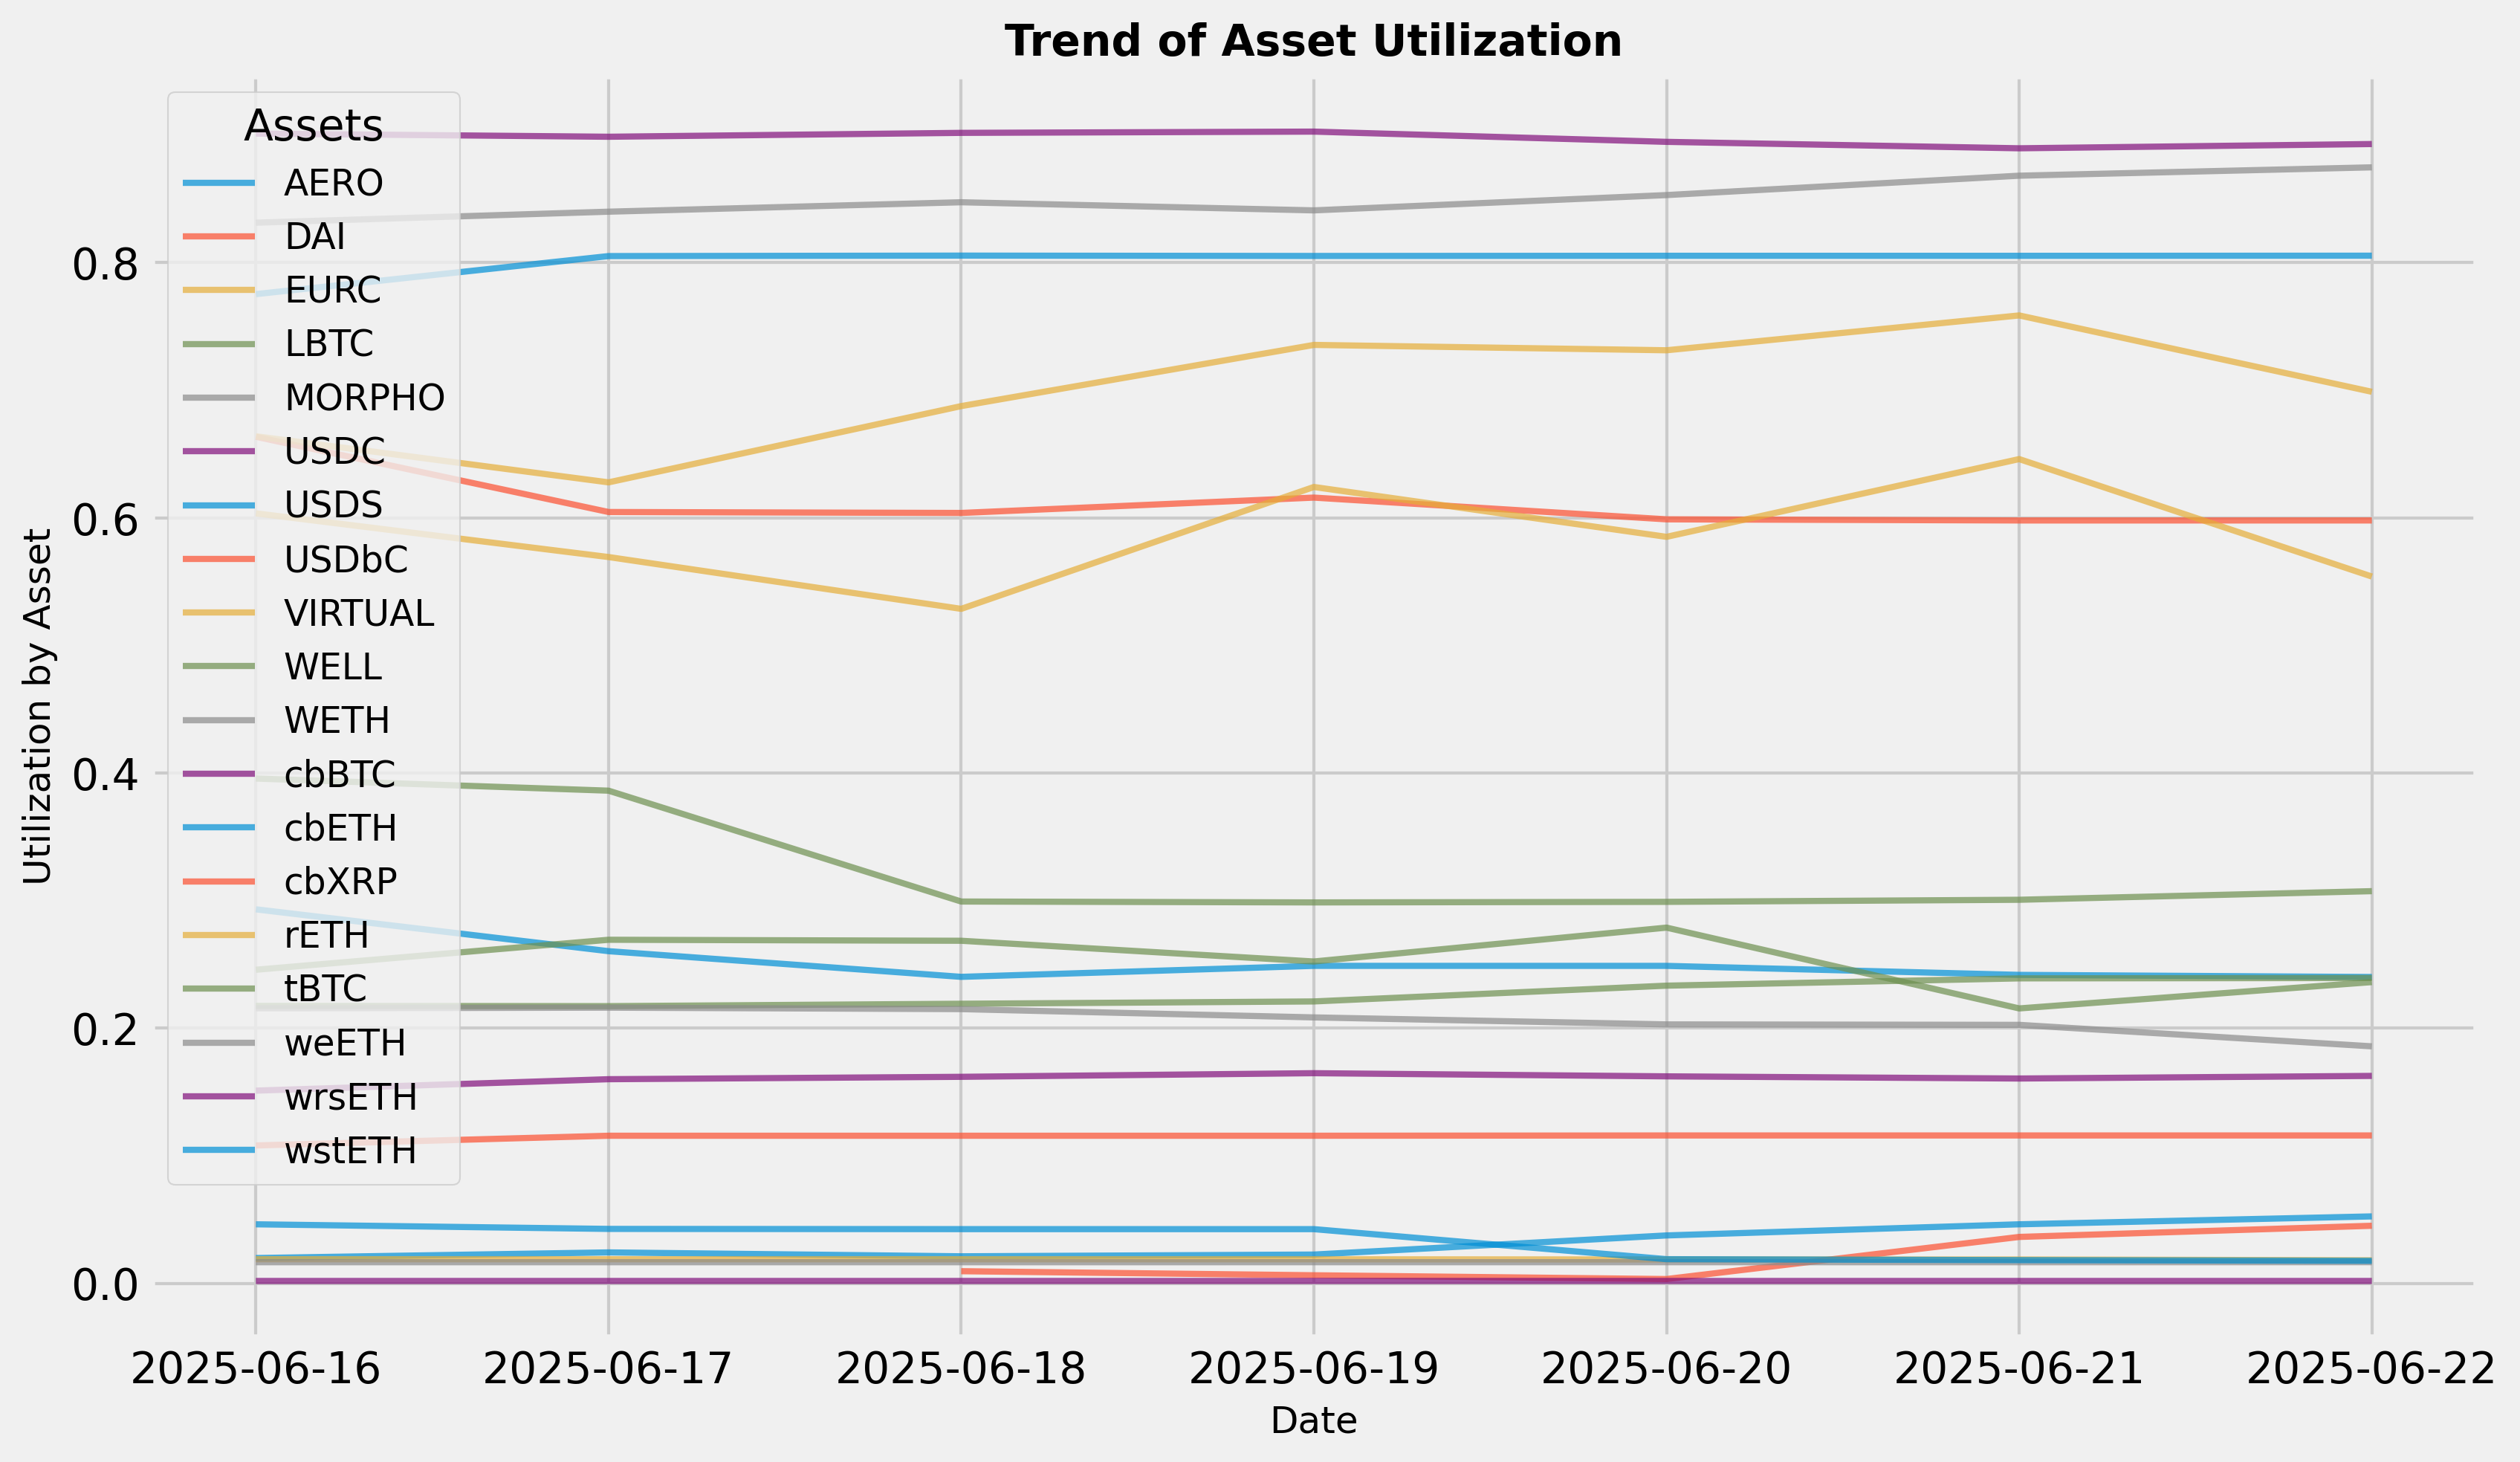
Utilization Trend
This graph shows the utilization (borrow / supply) of all assets over the time frame in question.
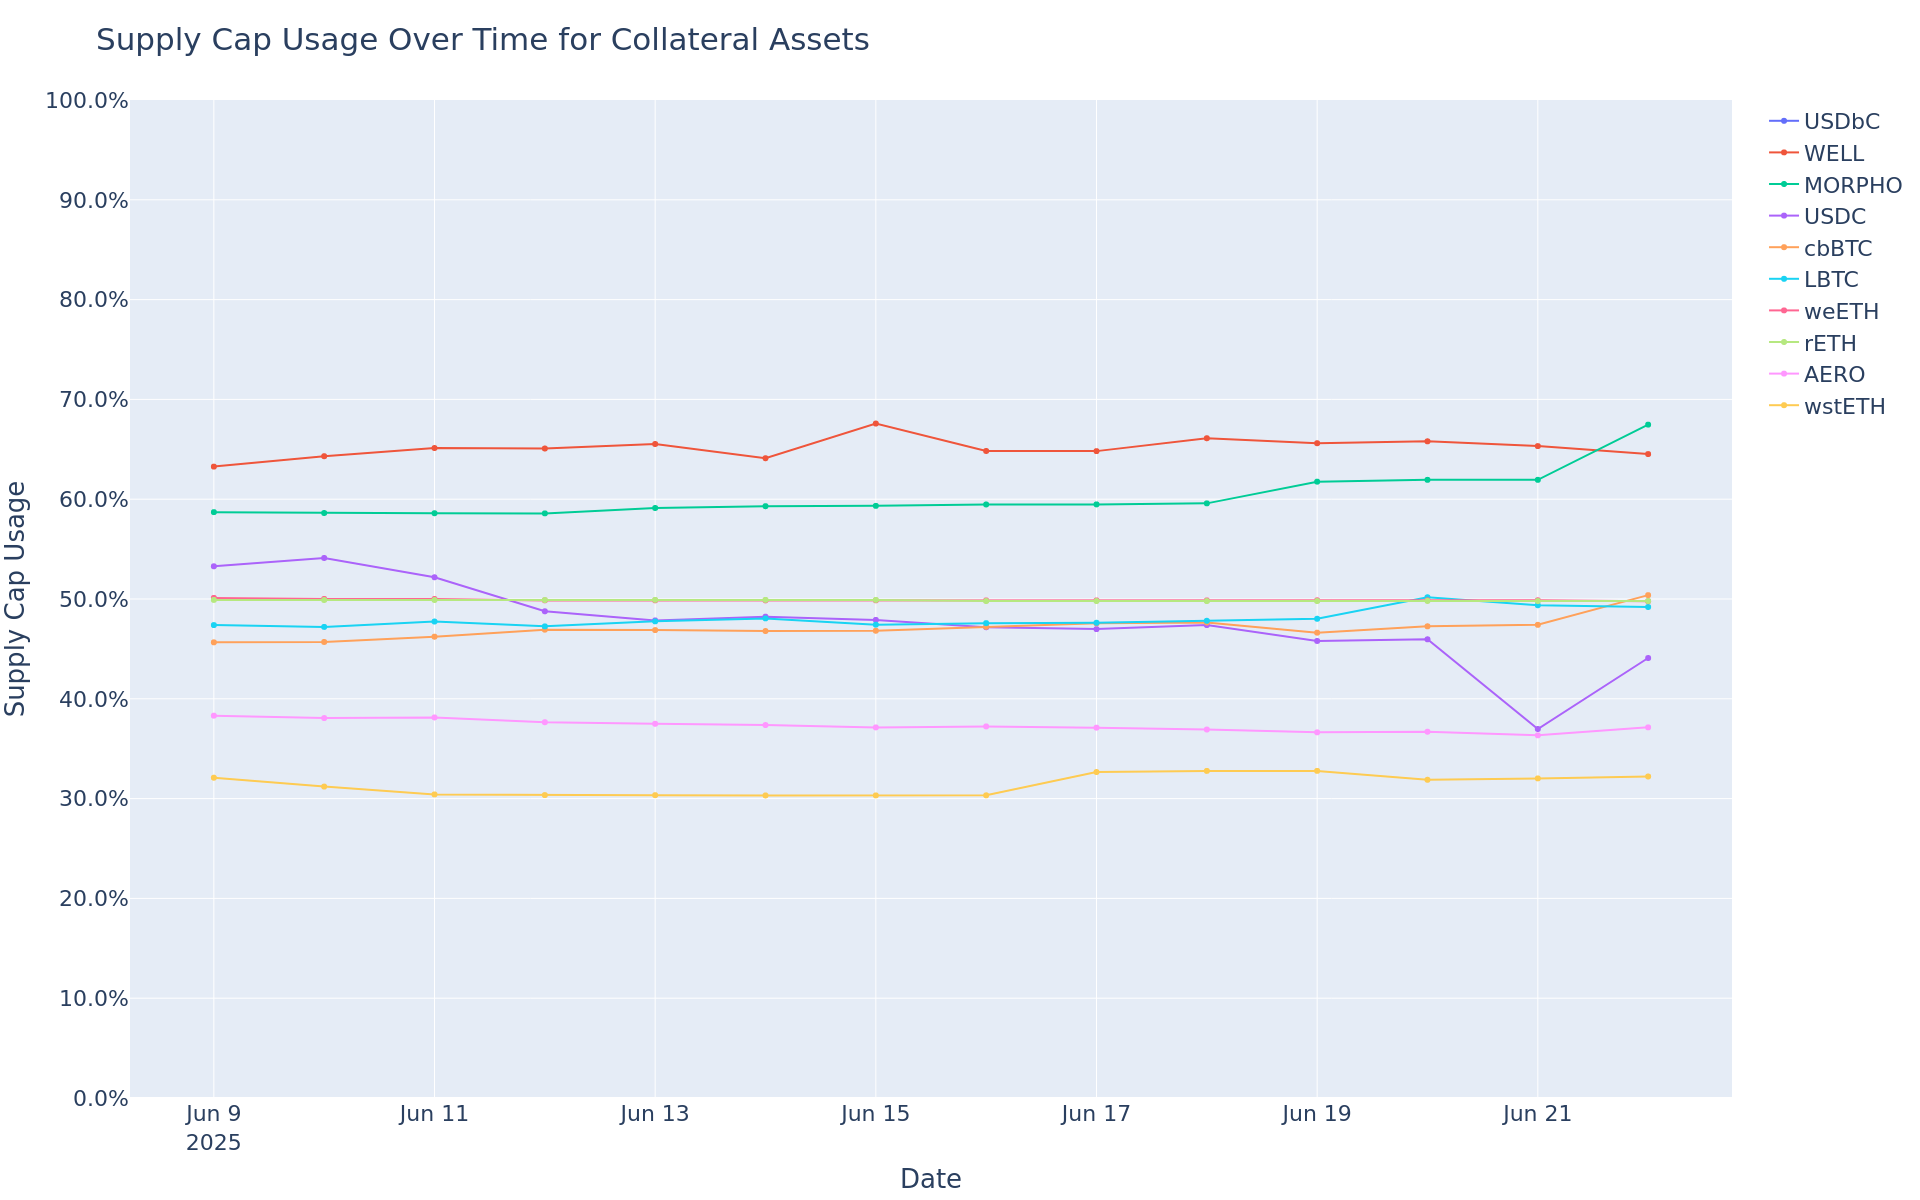
Supply Cap Usage Trend
This graph shows the supply cap usage (supply / supply cap) of all assets over the time frame in question.
Borrow Cap Usage Trend
This graph shows the borrow cap usage (borrow / borrow cap) of all assets over the time frame in question.

Optimism
Summary
This table gives high-level statistics over the time frame in question. Bold lines correspond to weekly utilization over 75%.
| Asset | Current Borrow Cap | Average Borrow Cap Usage (Past Week) | Average Supply Balance (Past Week) | Average Utilization | Current Global 2% Depth (USD) |
|---|---|---|---|---|---|
| USDC | 34.00M | 21.69% | 9.14M | 80.74% | $230.61M |
| VELO | 20.00M | 11.88% | 38.82M | 6.12% | $575.80K |
| USDT | 18.40M | 2.16% | 442.50K | 89.76% | $1.50B |
| USD₮0 | 8.00M | 34.61% | 4.96M | 55.84% | $3.81M |
| DAI | 4.50M | 3.83% | 223.17K | 77.21% | $3.06M |
| OP | 650.00K | 18.09% | 2.49M | 4.73% | $8.43M |
| WETH | 30.00K | 34.63% | 12.03K | 86.39% | $7.06M |
| wstETH | 1.50K | 3.87% | 934.97 | 6.21% | $78.68K |
| rETH | 340.00 | 4.53% | 111.30 | 13.83% | $75.47K |
| weETH | 220.00 | 15.90% | 842.41 | 4.15% | $82.88K |
| wrsETH | 160.00 | 3.43% | 35.09 | 15.64% | $165.47 |
| cbETH | 0.10 | 2.16% | 0.90 | 0.24% | $399.24K |
| WBTC | 0.00 | 3.19K% | 0.07 | 4.47% | $10.71M |
| VELO | 0.00 | 0.00% | 0.00 | 0.00% | $575.80K |
Top Movers
- DAI’s borrow balance increased WoW by 39% from $156K to $217K.
- wstETH’s borrow balance decreased WoW by 36% from $222K to $142K.
- DAI’s supply balance increased WoW by 20% from $217K to $260K.
- USDT’s supply balance decreased WoW by 26% from $323K to $240K.
- weETH’s utilization increased WoW by 51% from 3% to 5%.
- USD₮0’s utilization decreased WoW by 22% from 65% to 50%.
- No asset has supply or borrow cap usage above 75%.
Liquidations
| Liquidated Asset | Liquidated Amount (Tokens) | Liquidated Amount (USD) |
|---|---|---|
| mwstETH | 42.77 | $124.56K |
| mWETH | 1.58 | $3.61K |
| mOP | 4.84K | $2.44K |
| mUSDT0 | 2.04K | $2.04K |
| mVELO | 24.88K | $1.02K |
| mUSDC | 5.66 | $5.66 |
Weekly Annualized Reserve and Interest Projections

Supply Trend
This graph shows the total supply of all assets over the time frame in question. To see updated statistics, please see the live version of this graph here.

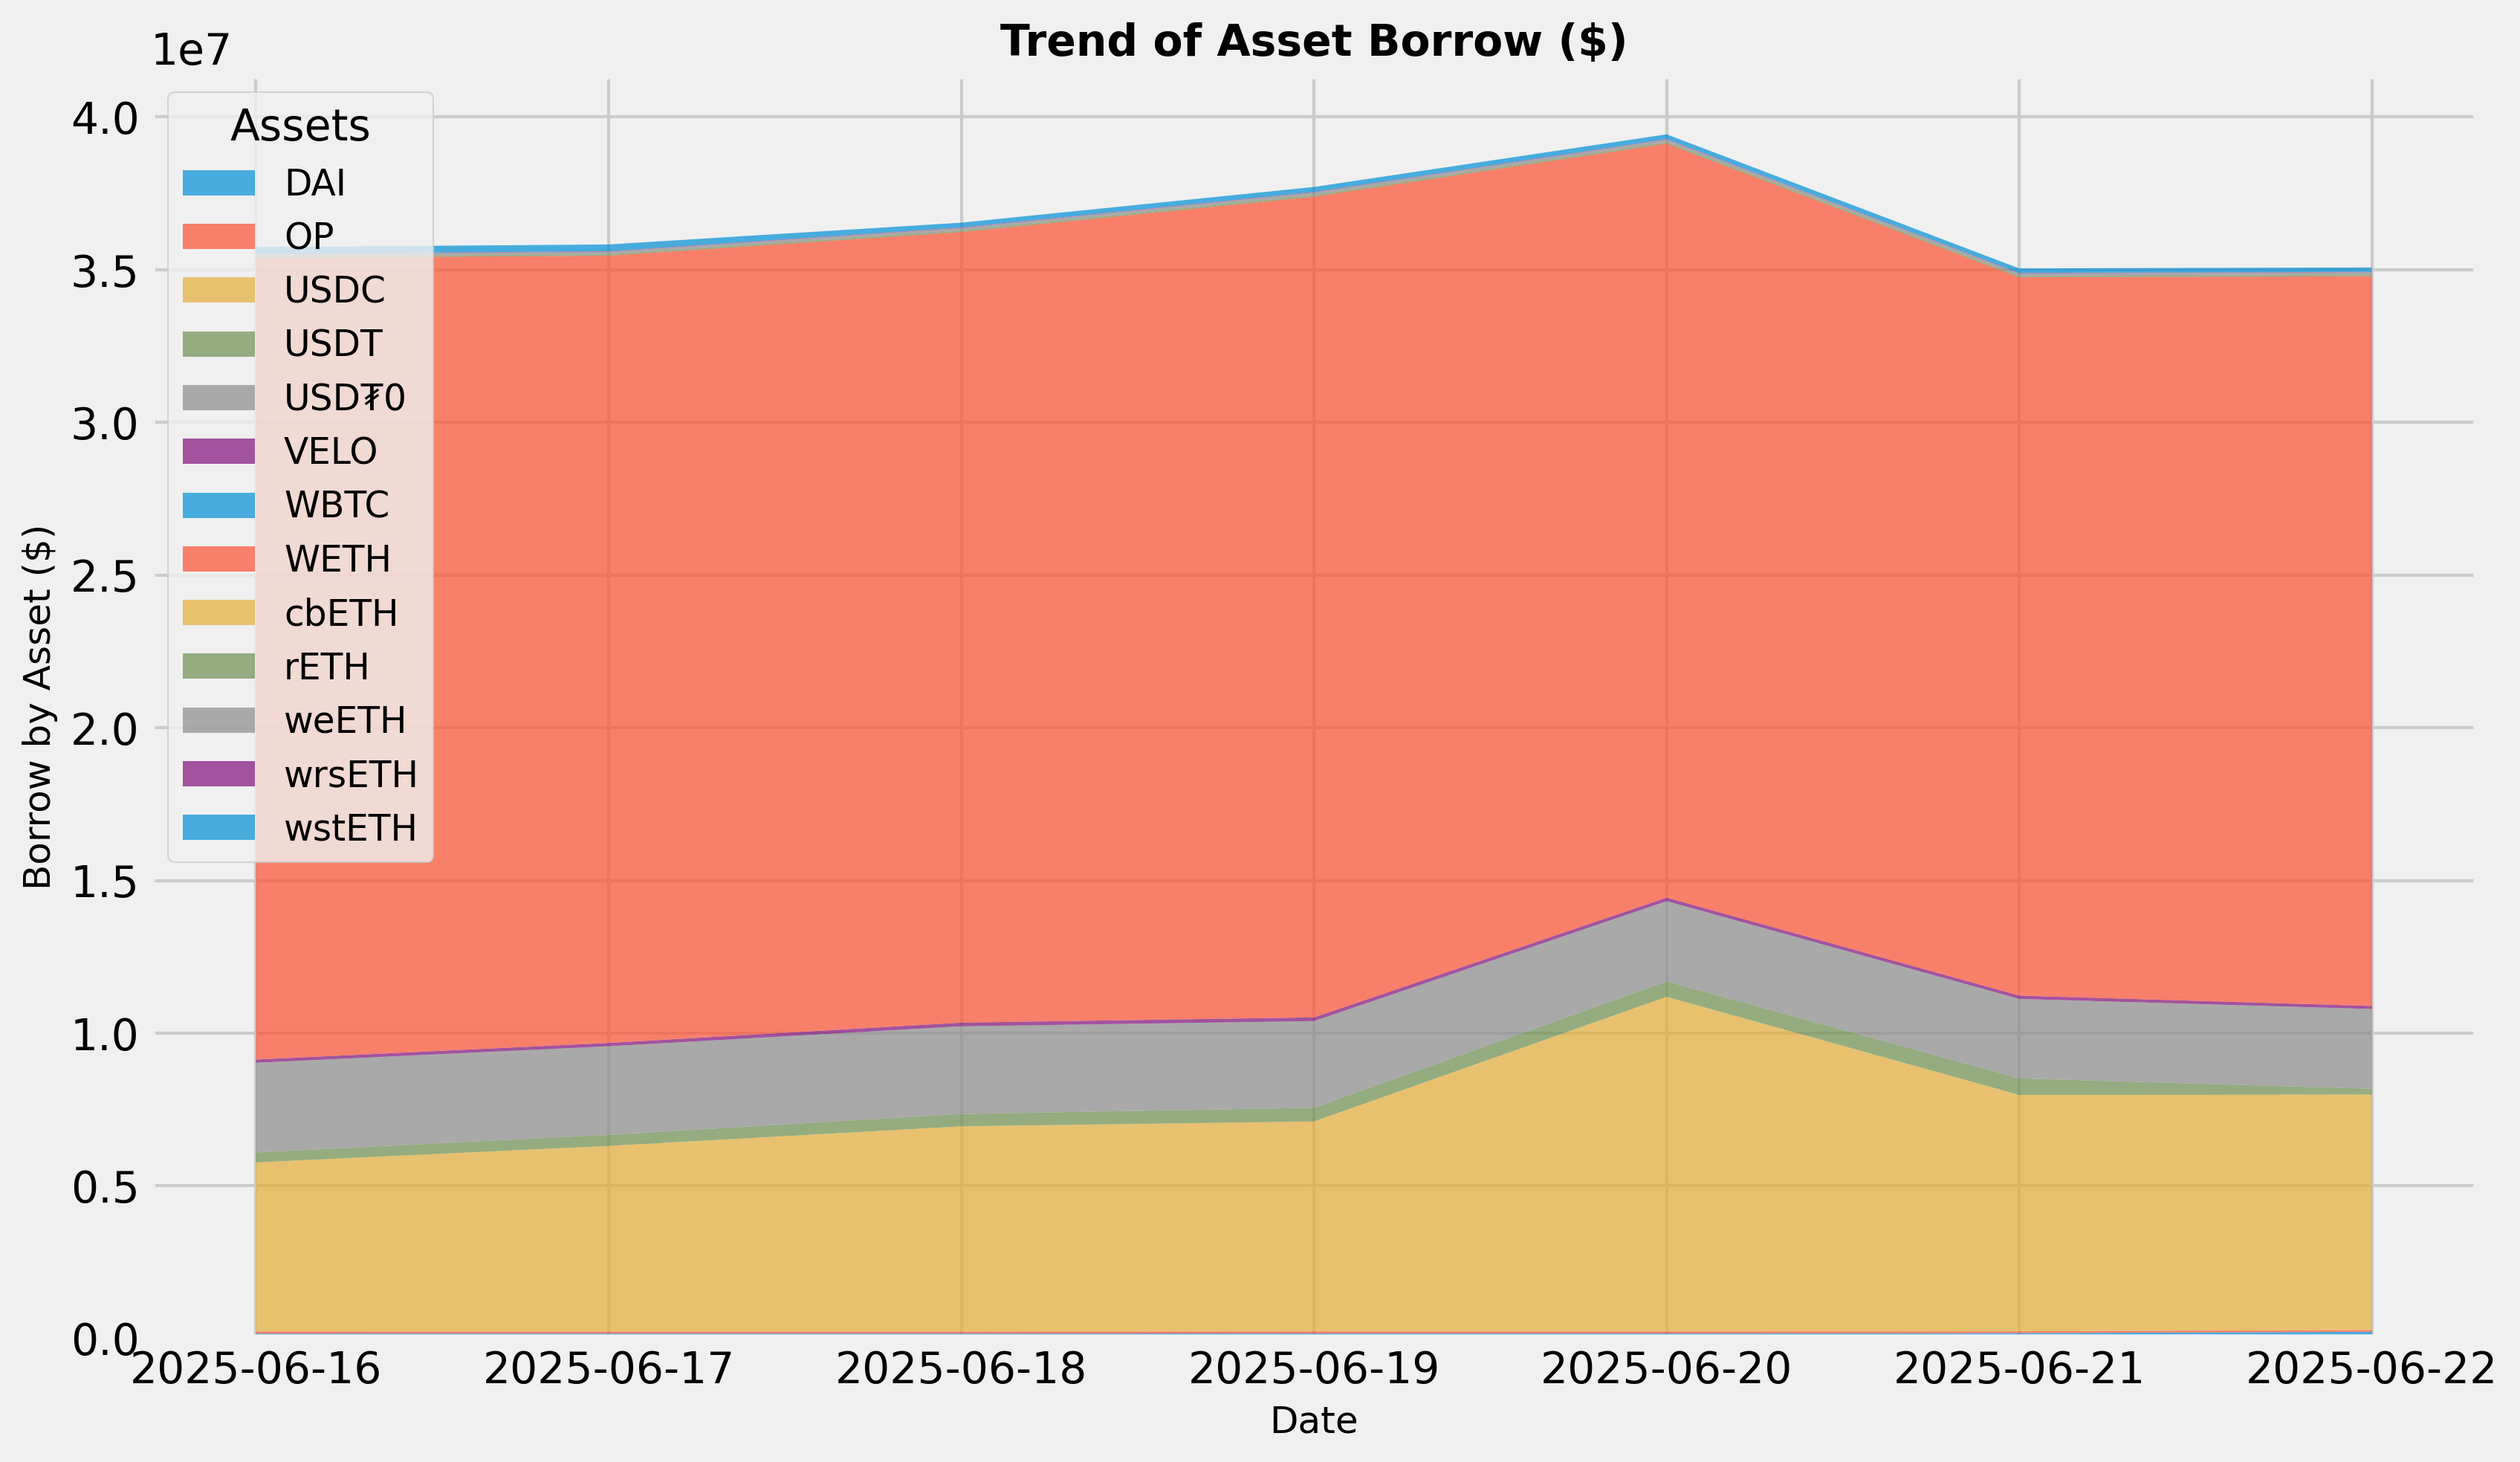
Borrows Trend
This graph shows the total borrows of all assets over the time frame in question. To see updated statistics, please see the live version of this graph here.
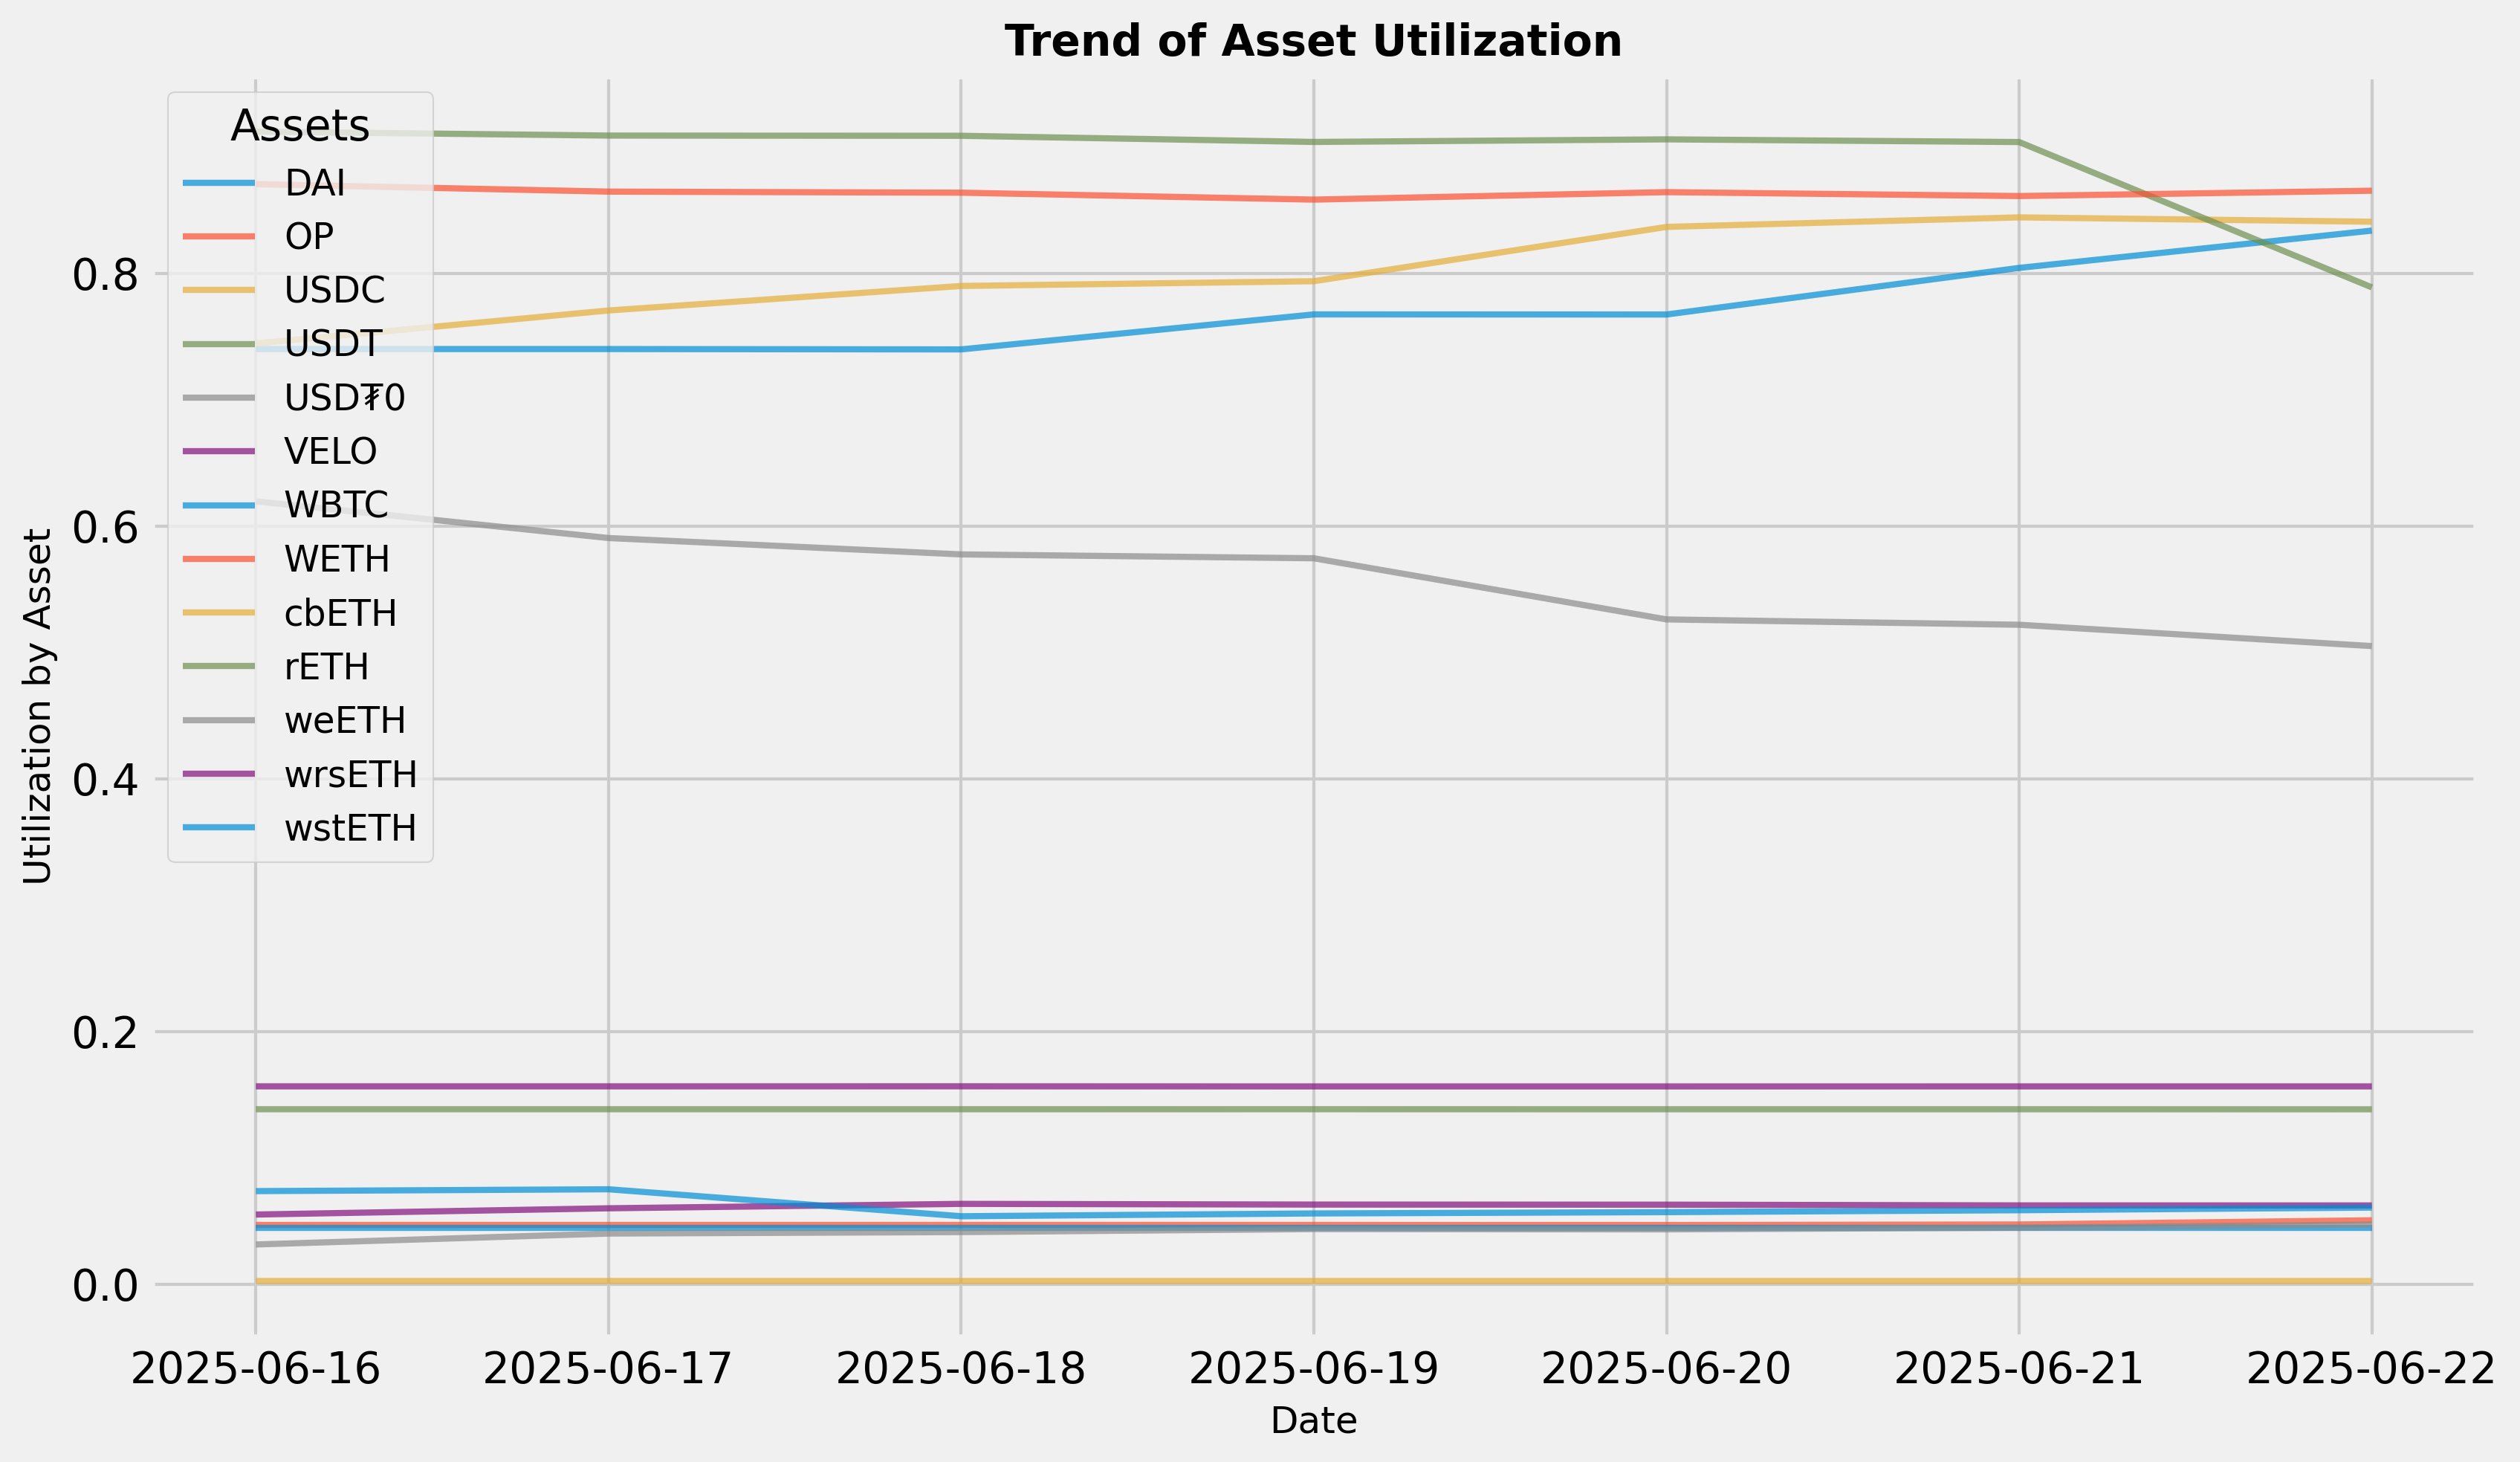
Utilization Trend
This graph shows the utilization (borrow / supply) of all assets over the time frame in question.
Borrow Cap Usage Trend
This graph shows the borrow cap usage (borrow / borrow cap) of all assets over the time frame in question.

Moonbeam
Summary
This table gives high-level statistics over the time frame in question. Bold lines correspond to weekly utilization over 75%.
| Asset | Current Borrow Cap | Average Borrow Cap Usage (Past Week) | Average Supply Balance (Past Week) | Average Utilization | Current Global 2% Depth (USD) |
|---|---|---|---|---|---|
| FRAX | 0.10 | 643.21K% | 62.81K | 1.02% | $30.87K |
| WETH.wh | 0.10 | 2.16K% | 42.03 | 5.15% | $7.06M |
| WGLMR | 0.10 | 6.39B% | 11.64M | 54.90% | $789.49 |
| WBTC.wh | 0.10 | 32.13% | 0.90 | 3.58% | $10.71M |
| xcDOT | 0.10 | 30.67M% | 542.26K | 5.66% | $536.06 |
| USDC.wh | 0.10 | 59.98M% | 92.61K | 64.77% | $230.61M |
| xcUSDC | 0.10 | 141.57M% | 254.01K | 55.74% | $230.61M |
Top Movers
- WBTC.wh’s borrow balance decreased WoW by 57% from $4K to $2K.
- WGLMR’s supply balance decreased WoW by 28% from $893K to $645K.
- WGLMR’s utilization increased WoW by 13% from 53% to 60%.
- WBTC.wh’s utilization decreased WoW by 54% from 4% to 2%.
- No asset has supply or borrow cap usage above 75%.
Liquidations
| Liquidated Asset | Liquidated Amount (Tokens) | Liquidated Amount (USD) |
|---|---|---|
| mGLMR | 836.35K | $54.85K |
| mDOT | 8.60K | $28.65K |
| mxcUSDT | 1.45K | $1.45K |
| mxcUSDC | 731.36 | $731.23 |
| mFRAX | 706.18 | $705.62 |
| mUSDC.wh | 430.83 | $430.76 |
| mWBTC.wh | 0.00 | $152.17 |
| mETH.wh | 0.01 | $22.58 |
Weekly Annualized Reserve and Interest Projections

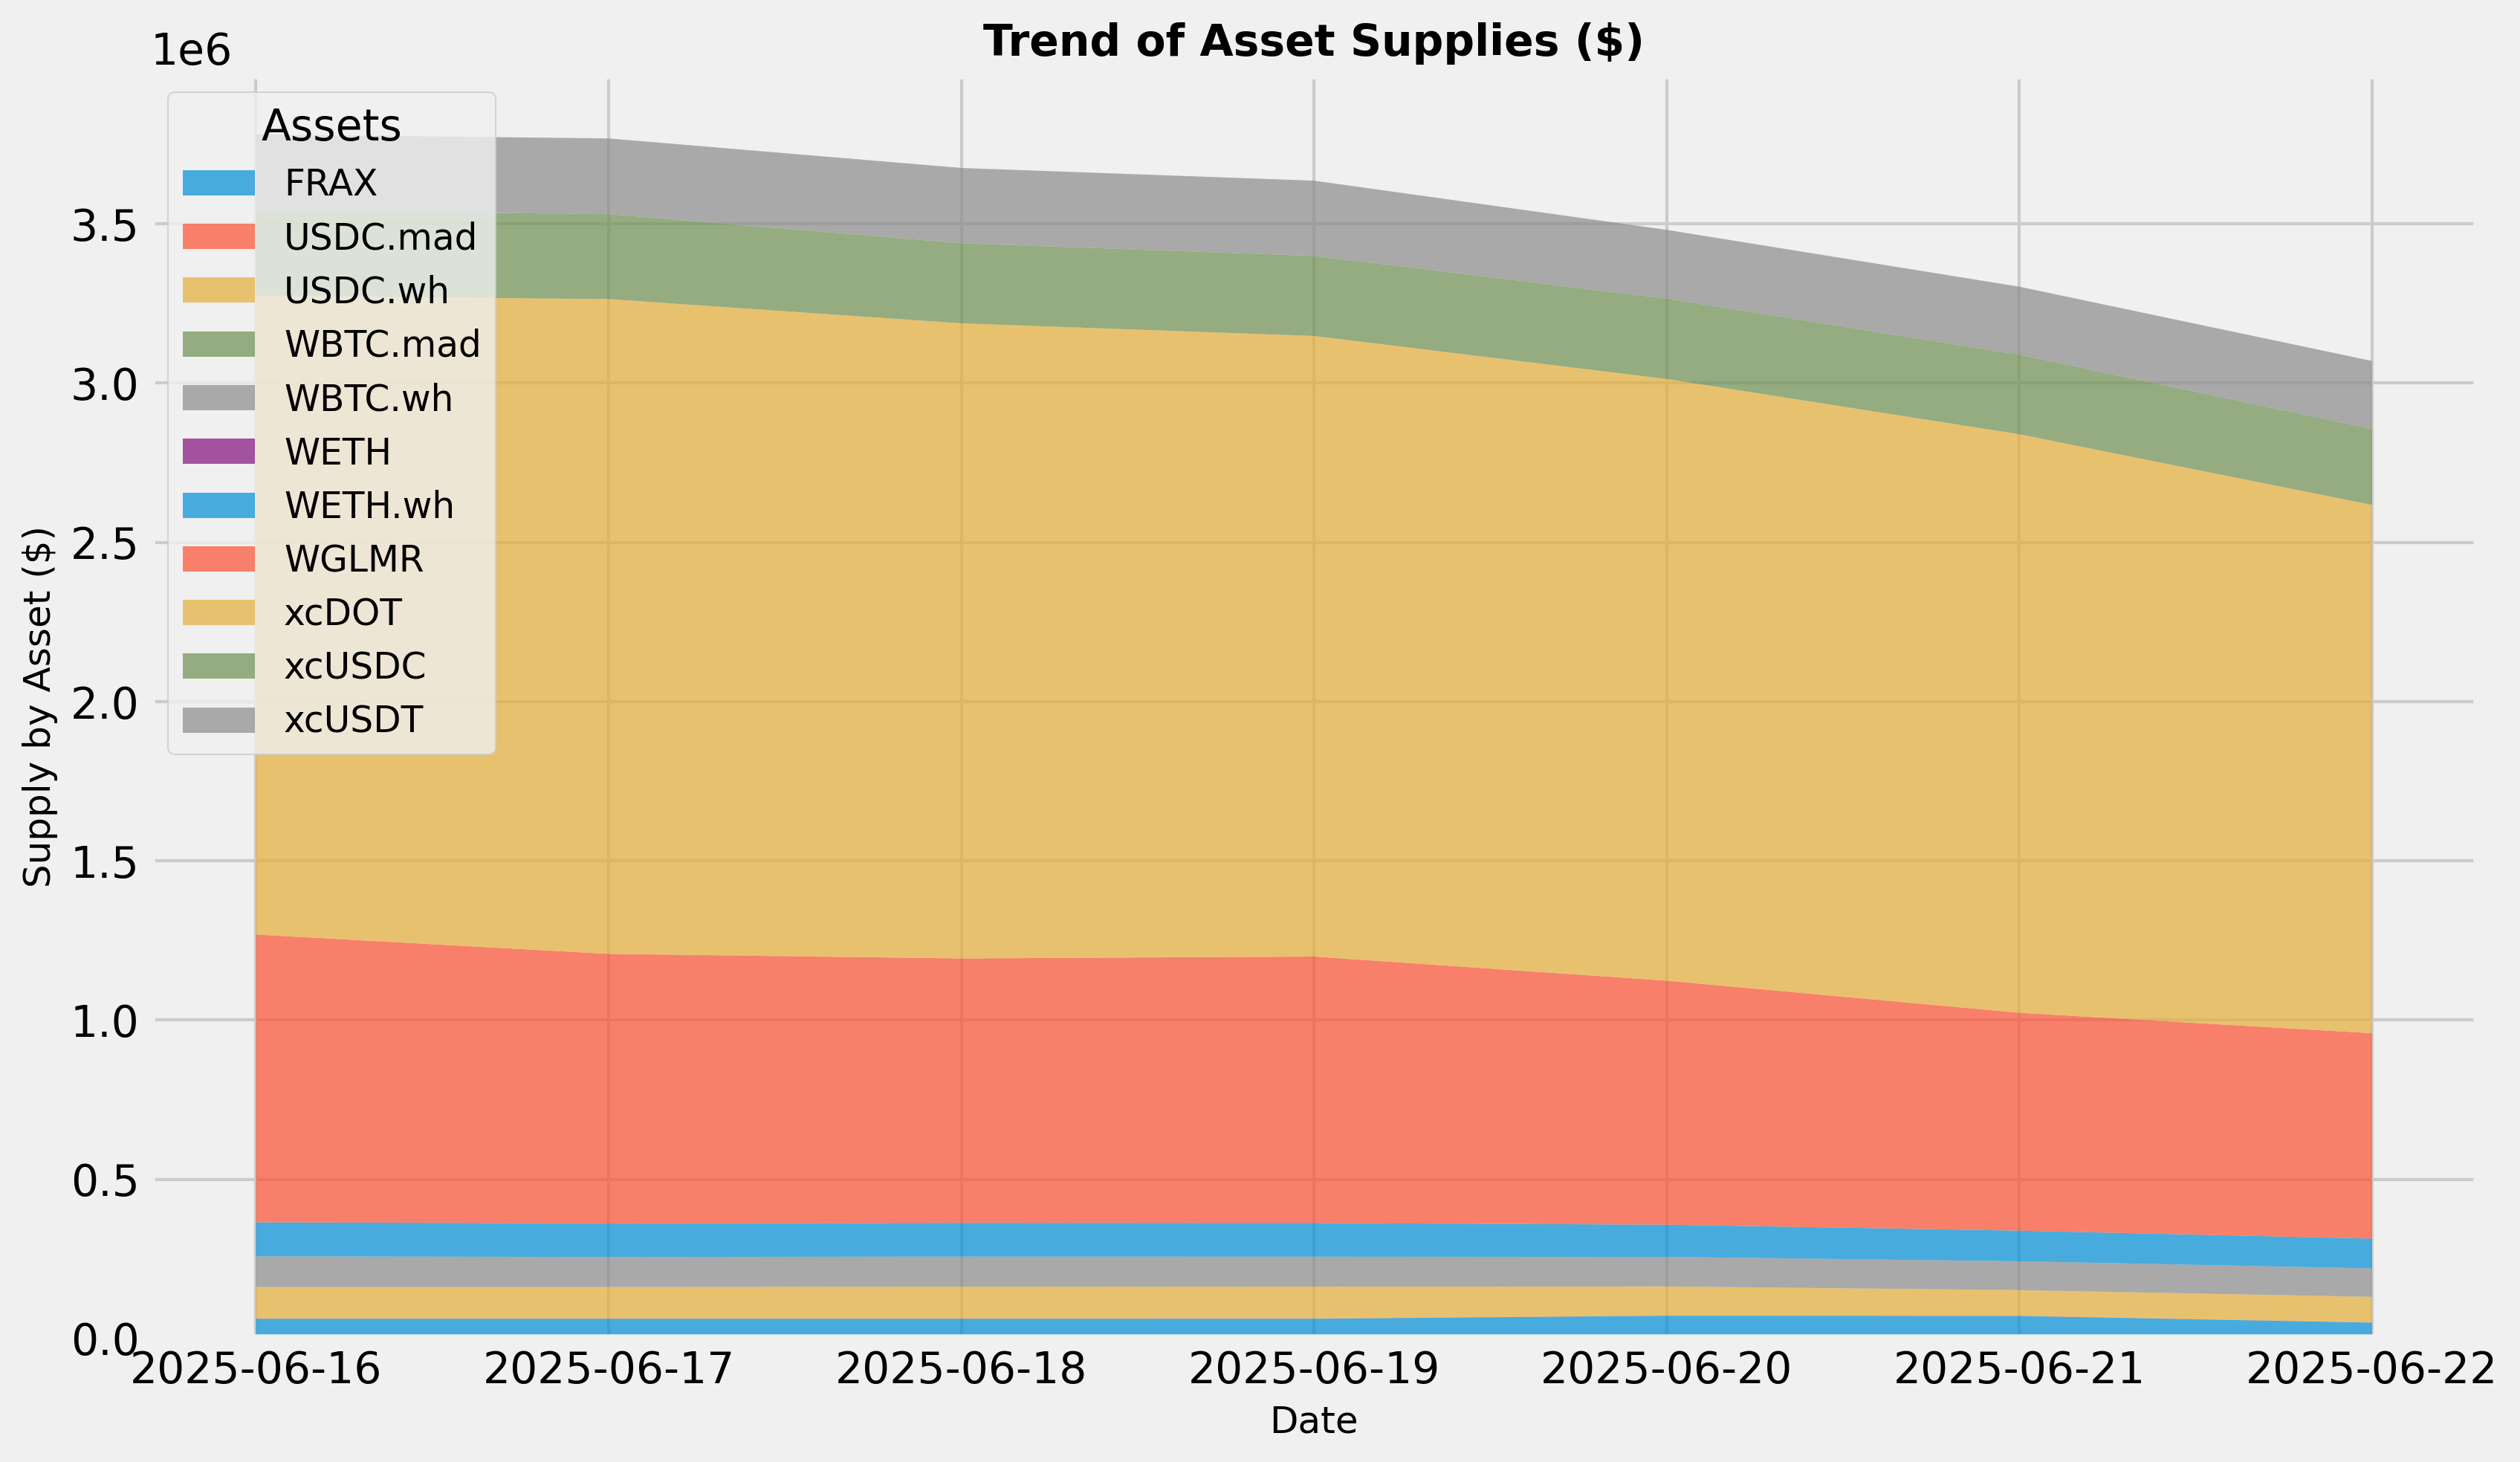
Supply Trend
This graph shows the total supply of all assets over the time frame in question. To see updated statistics, please see the live version of this graph here.
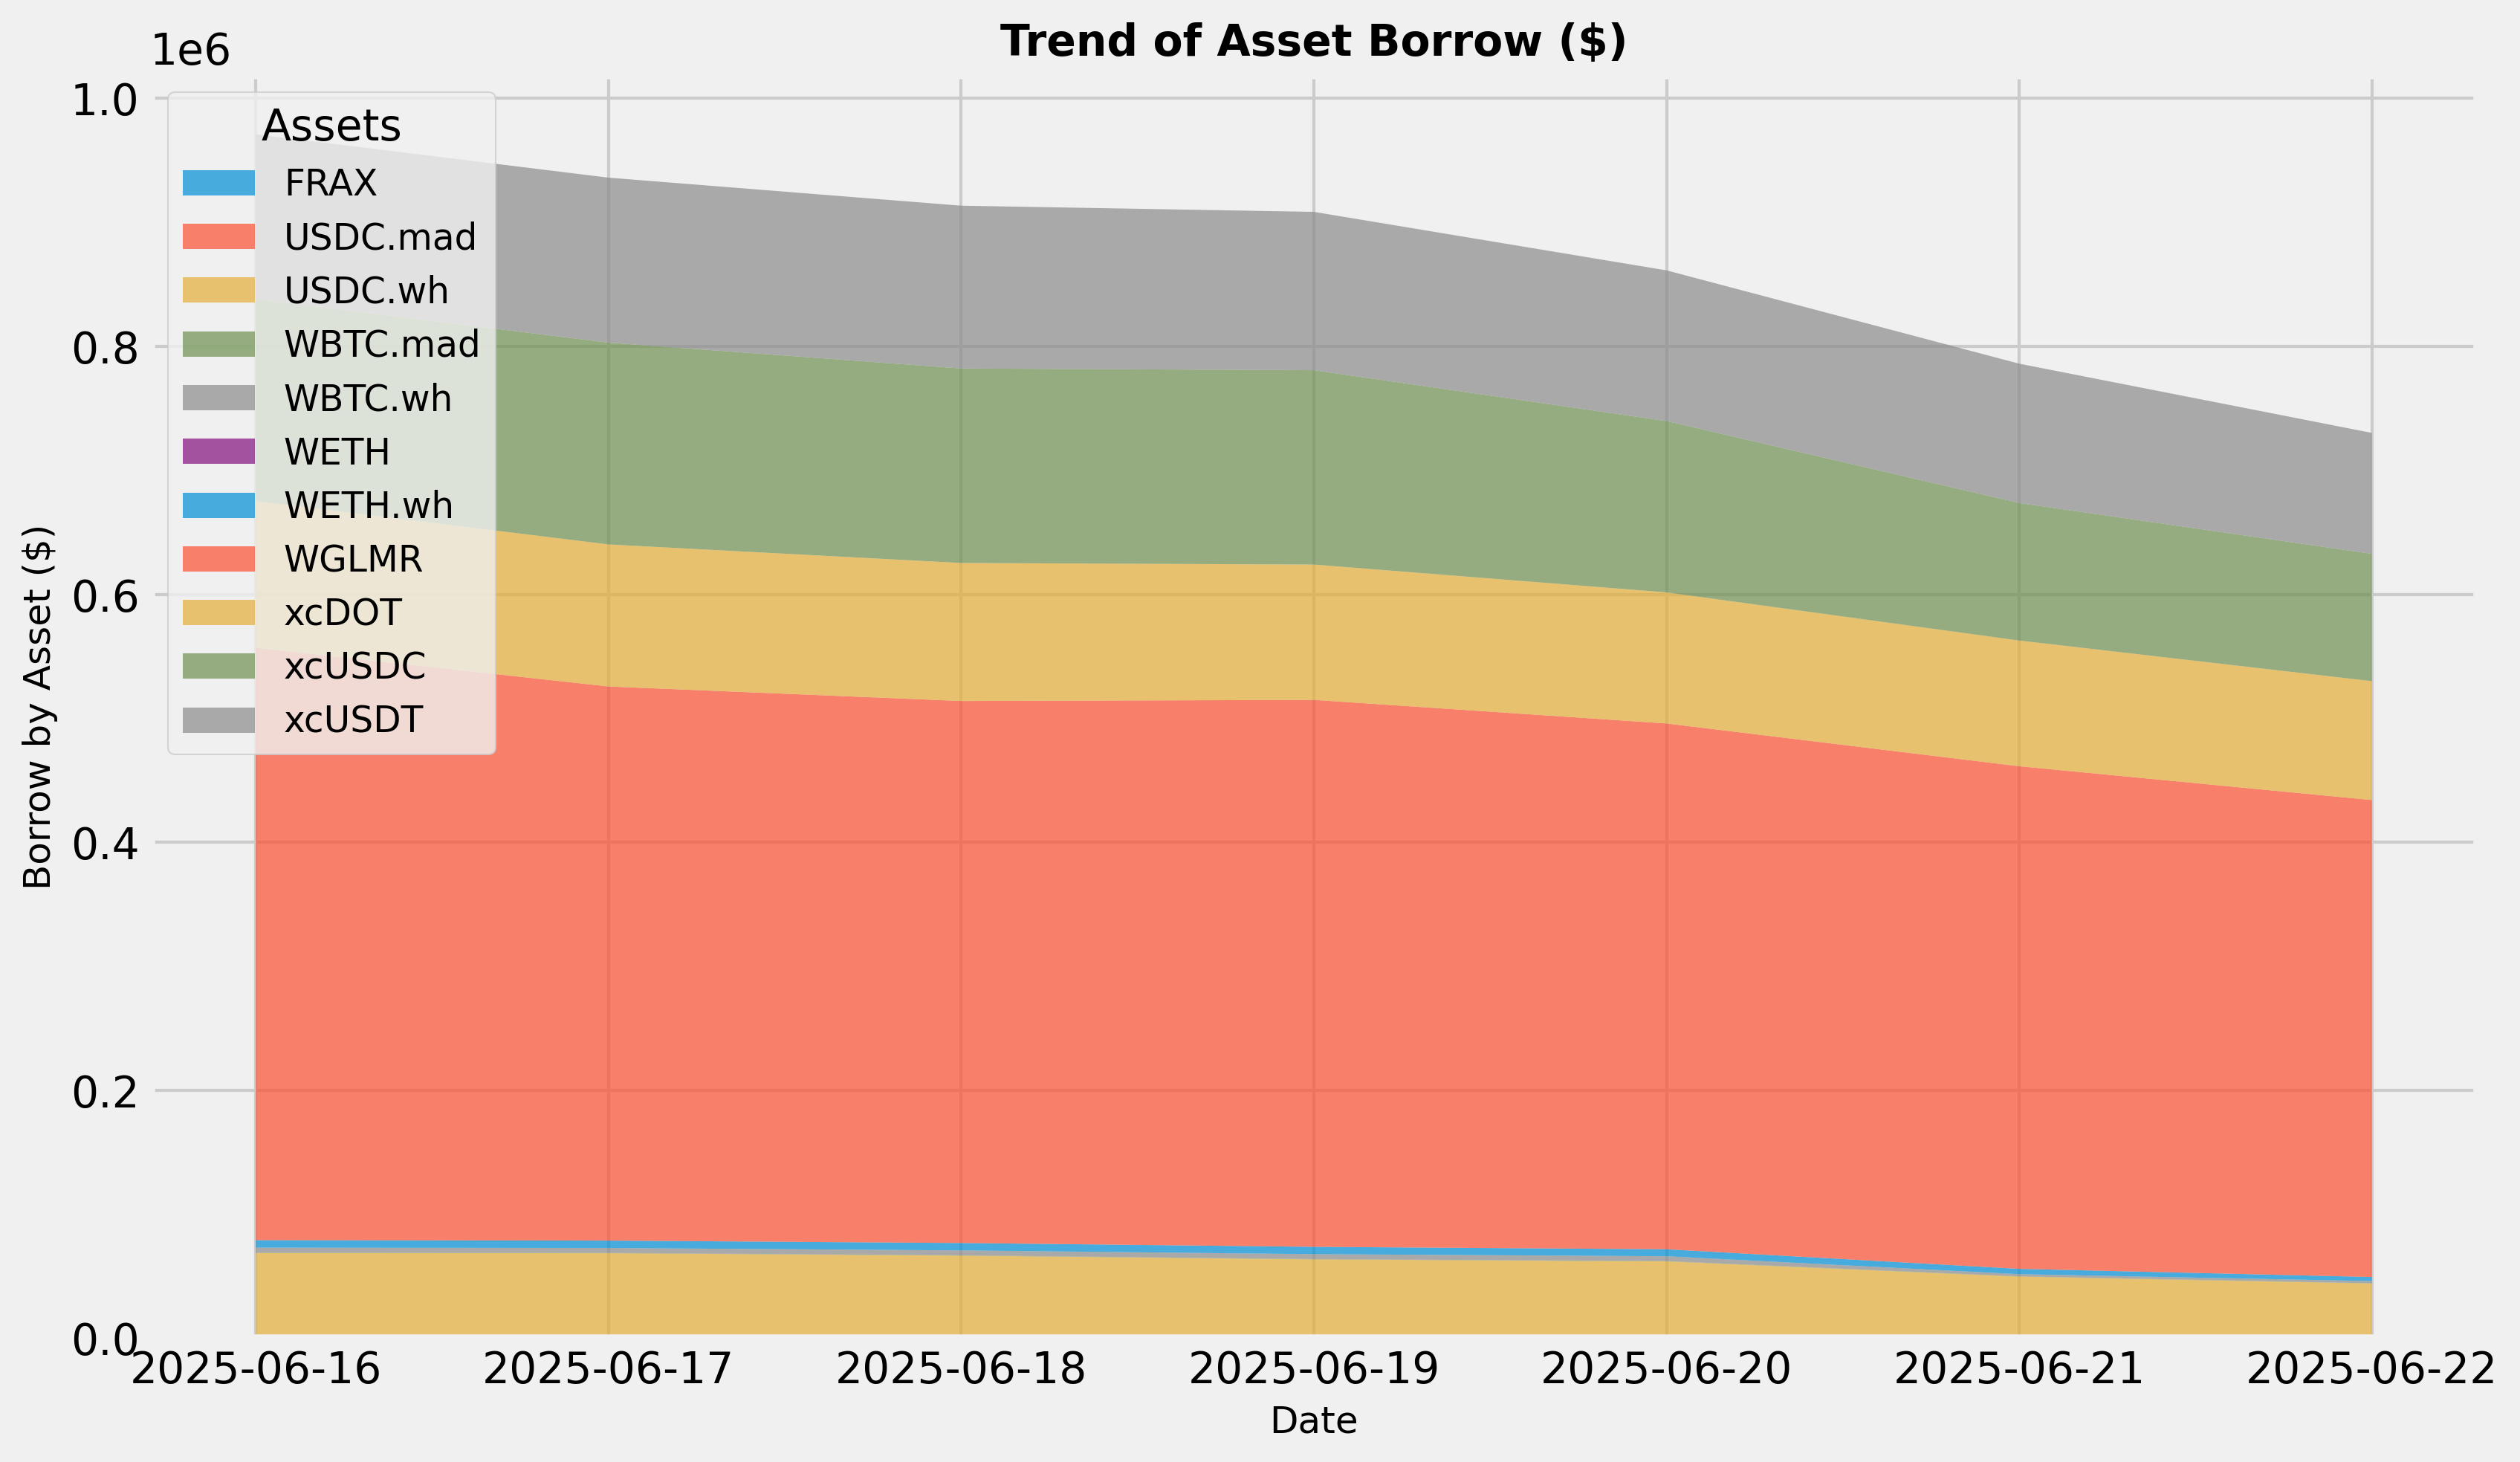
Borrows Trend
This graph shows the total borrows of all assets over the time frame in question. To see updated statistics, please see the live version of this graph here.
Utilization Trend
This graph shows the utilization (borrow / supply) of all assets over the time frame in question.

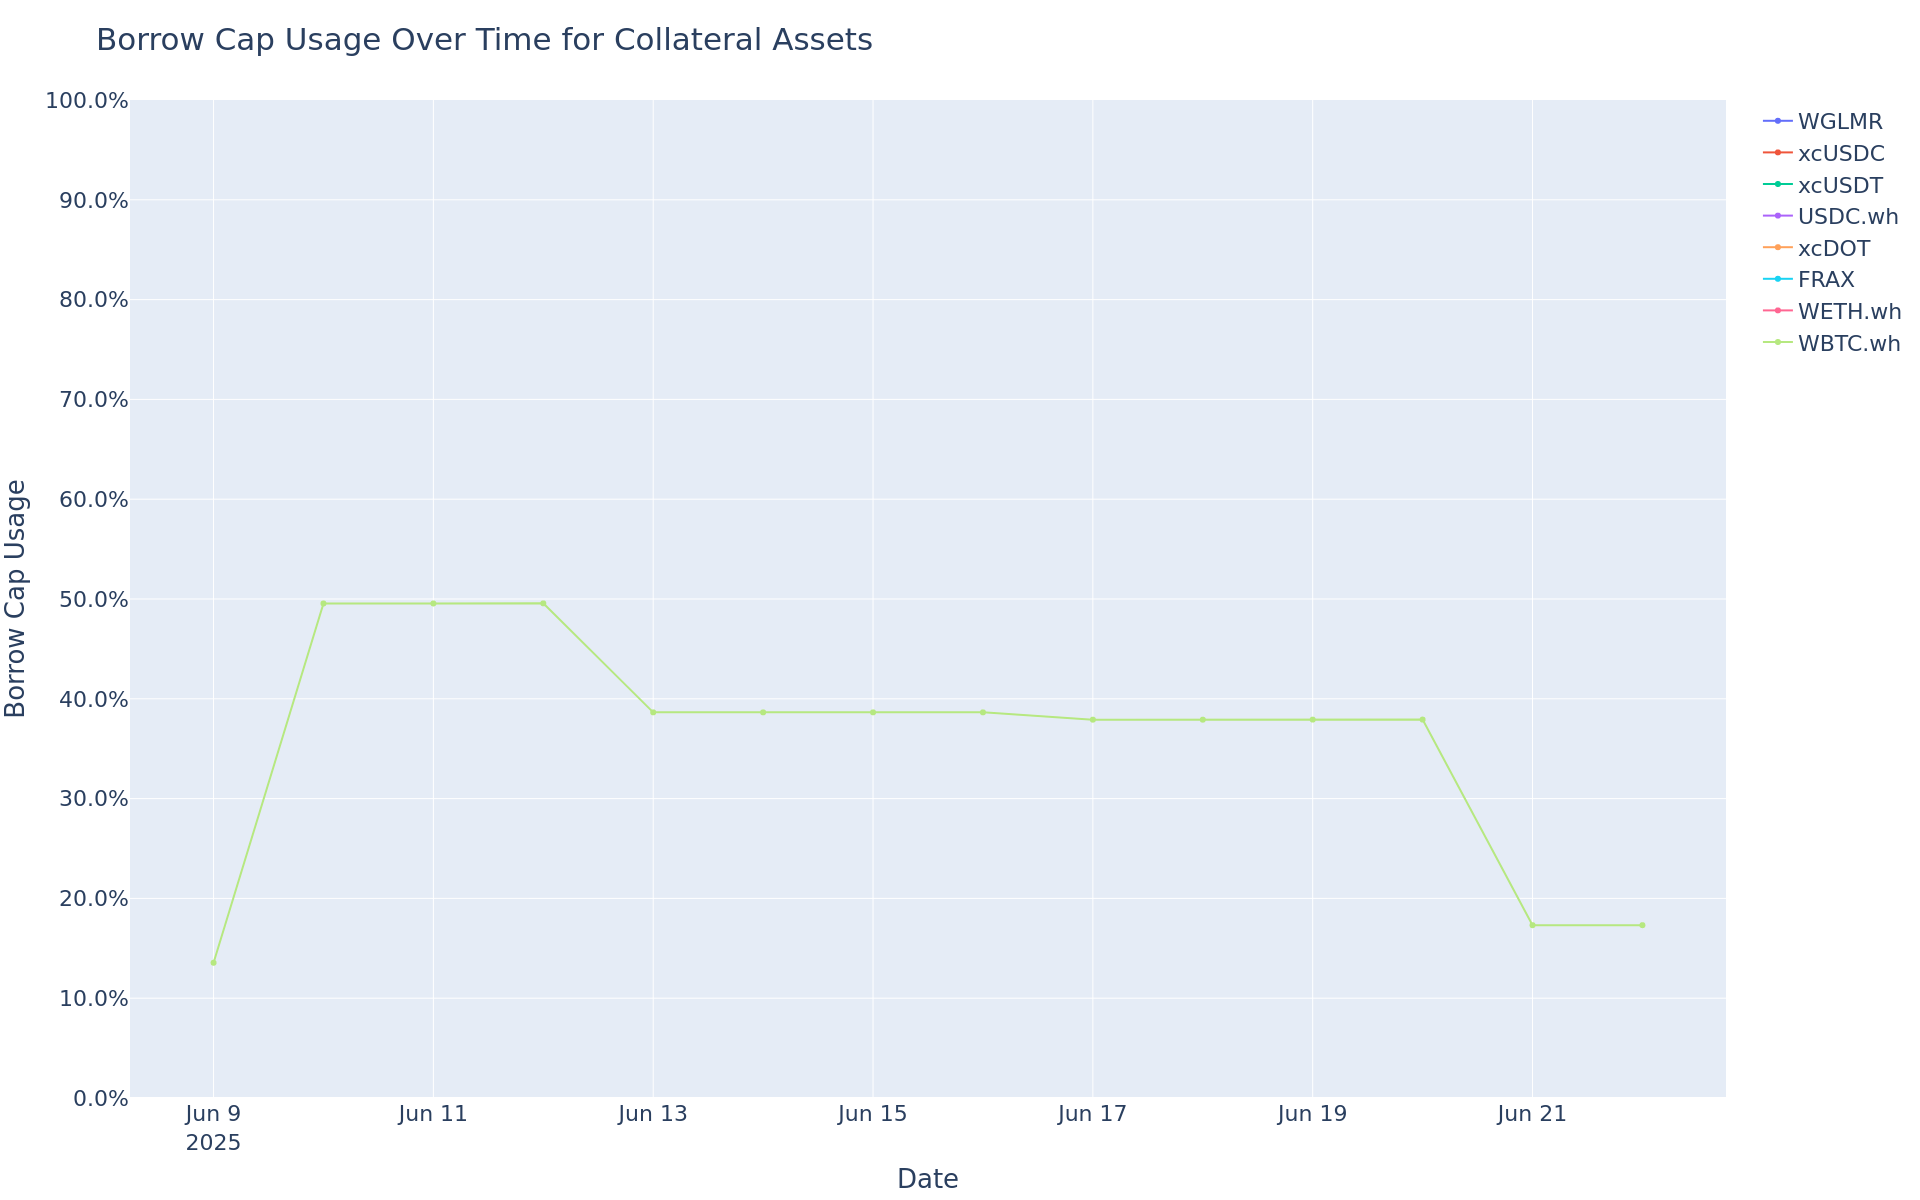
Borrow Cap Usage Trend
This graph shows the borrow cap usage (borrow / borrow cap) of all assets over the time frame in question.
Moonriver
Summary
This table gives high-level statistics over the time frame in question. Bold lines correspond to weekly utilization over 75%.
| Asset | Current Borrow Cap | Average Borrow Cap Usage (Past Week) | Average Supply Balance (Past Week) | Average Utilization | Current Global 2% Depth (USD) |
|---|---|---|---|---|---|
| FRAX | 0.10 | 77.13M% | 105.30K | 73.25% | $30.87K |
| WMOVR | 0.10 | 3.80M% | 127.65K | 2.98% | $269.20K |
Top Movers
- xcKSM’s borrow balance decreased WoW by 14% from $127K to $109K.
- xcKSM’s supply balance decreased WoW by 15% from $269K to $230K.
- FRAX’s utilization decreased WoW by 1% from 74% to 73%.
- No asset has supply or borrow cap usage above 75%.
Liquidations
| Liquidated Asset | Liquidated Amount (Tokens) | Liquidated Amount (USD) |
|---|---|---|
| mMOVR | 0.21 | $1.11 |
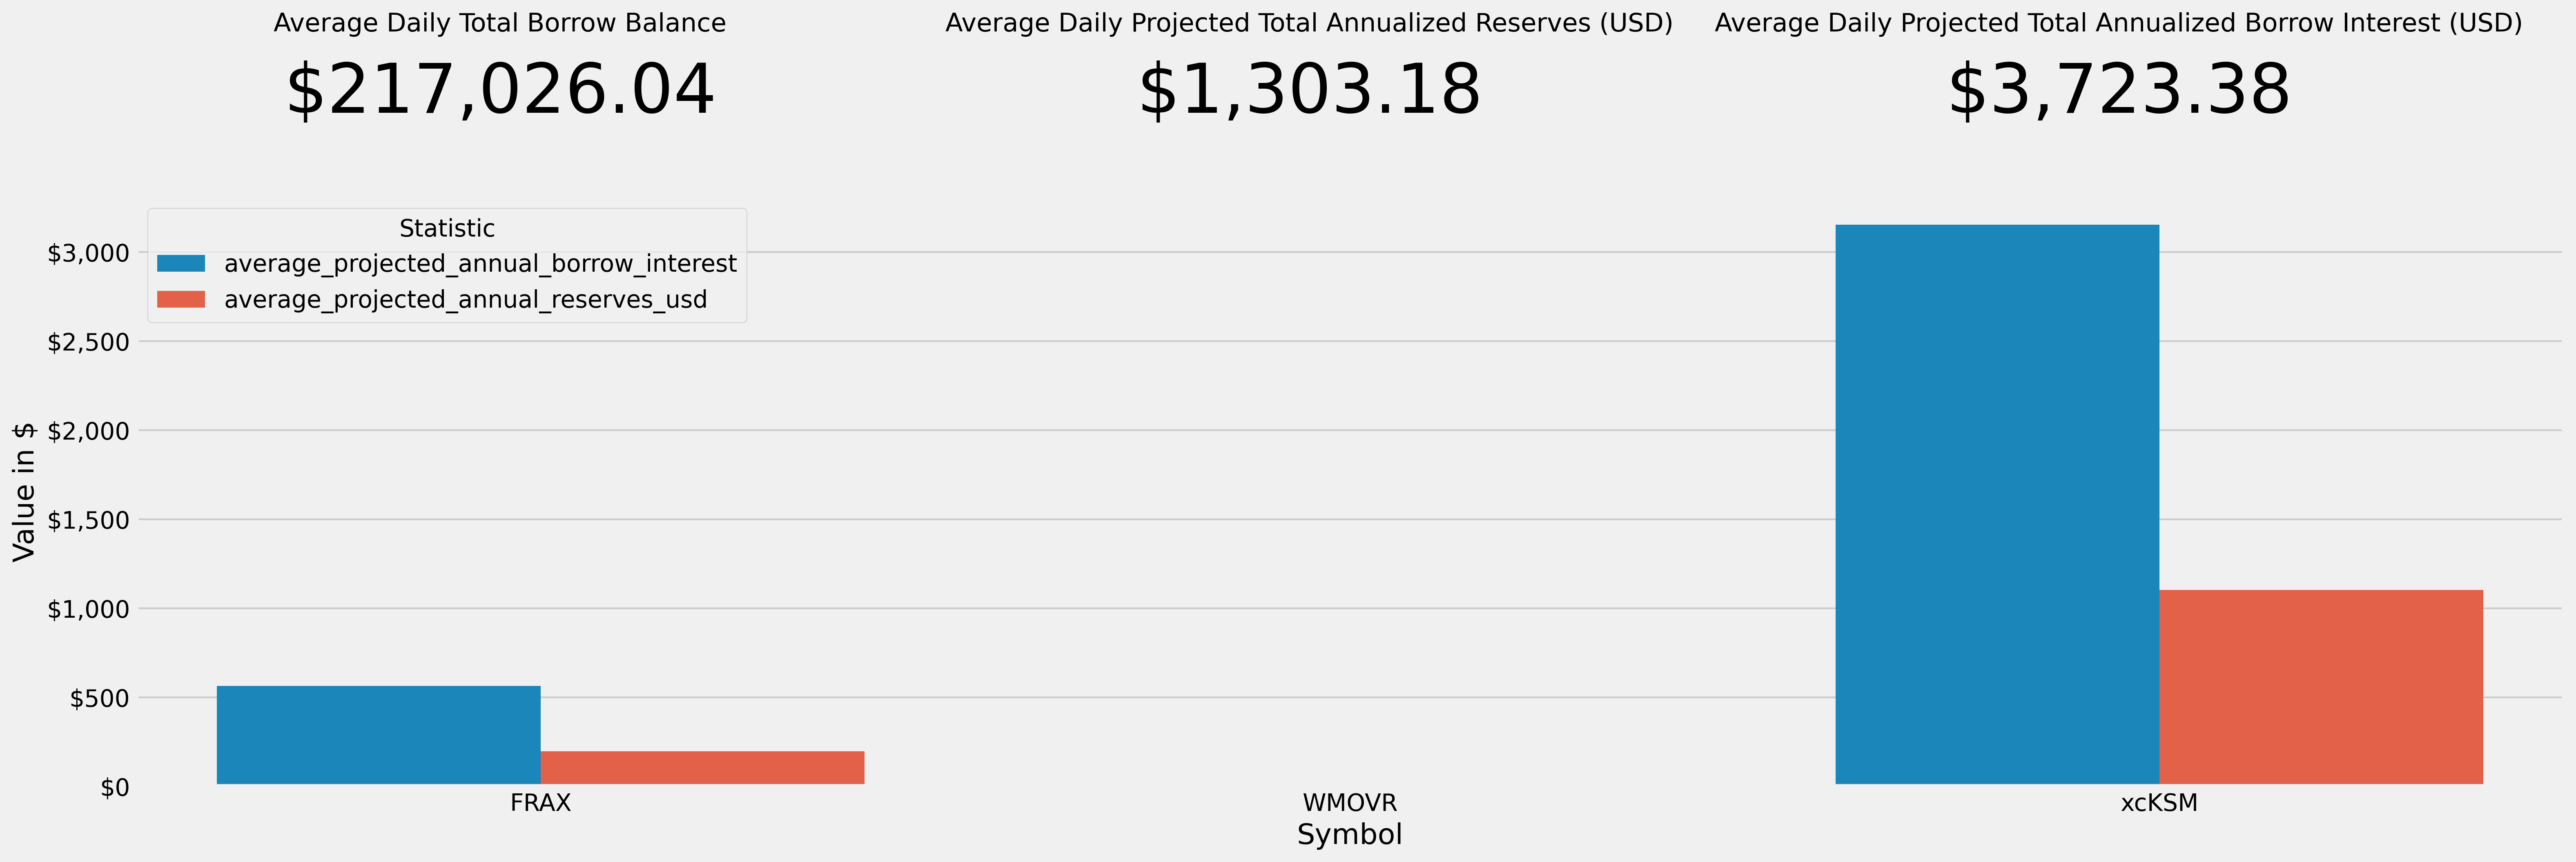
Weekly Annualized Reserve and Interest Projections
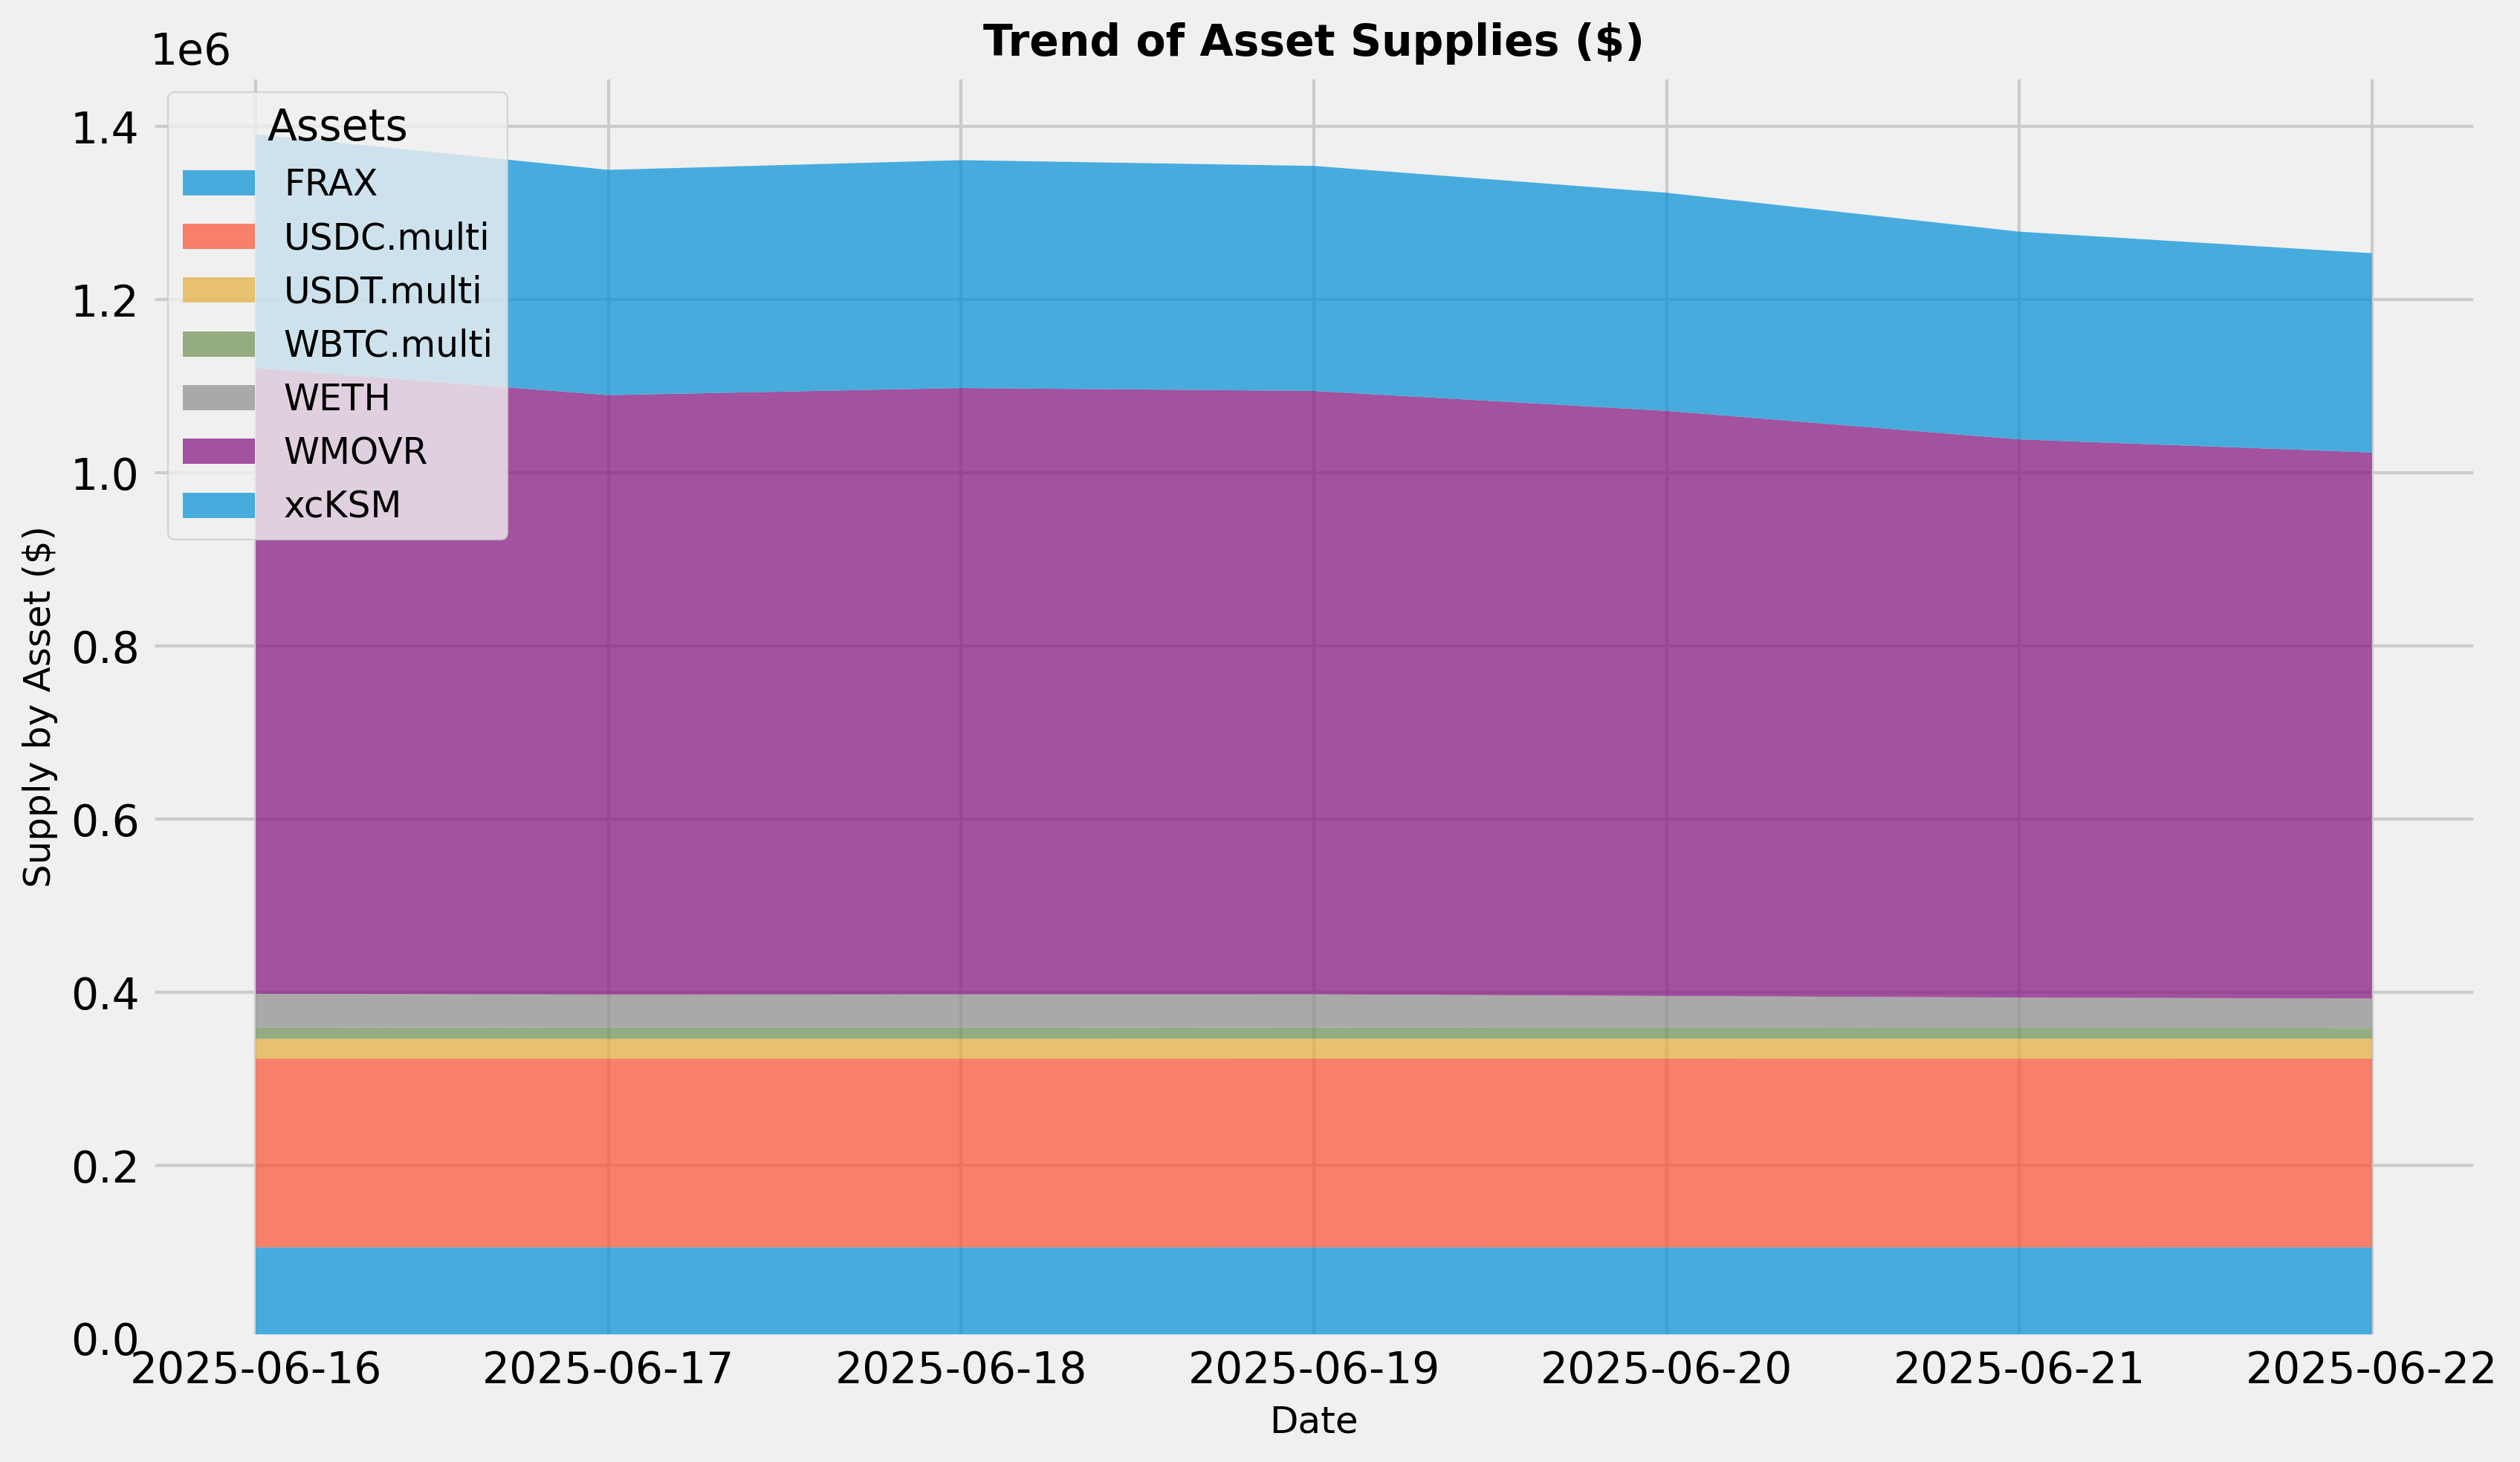
Supply Trend
This graph shows the total supply of all assets over the time frame in question. To see updated statistics, please see the live version of this graph here.
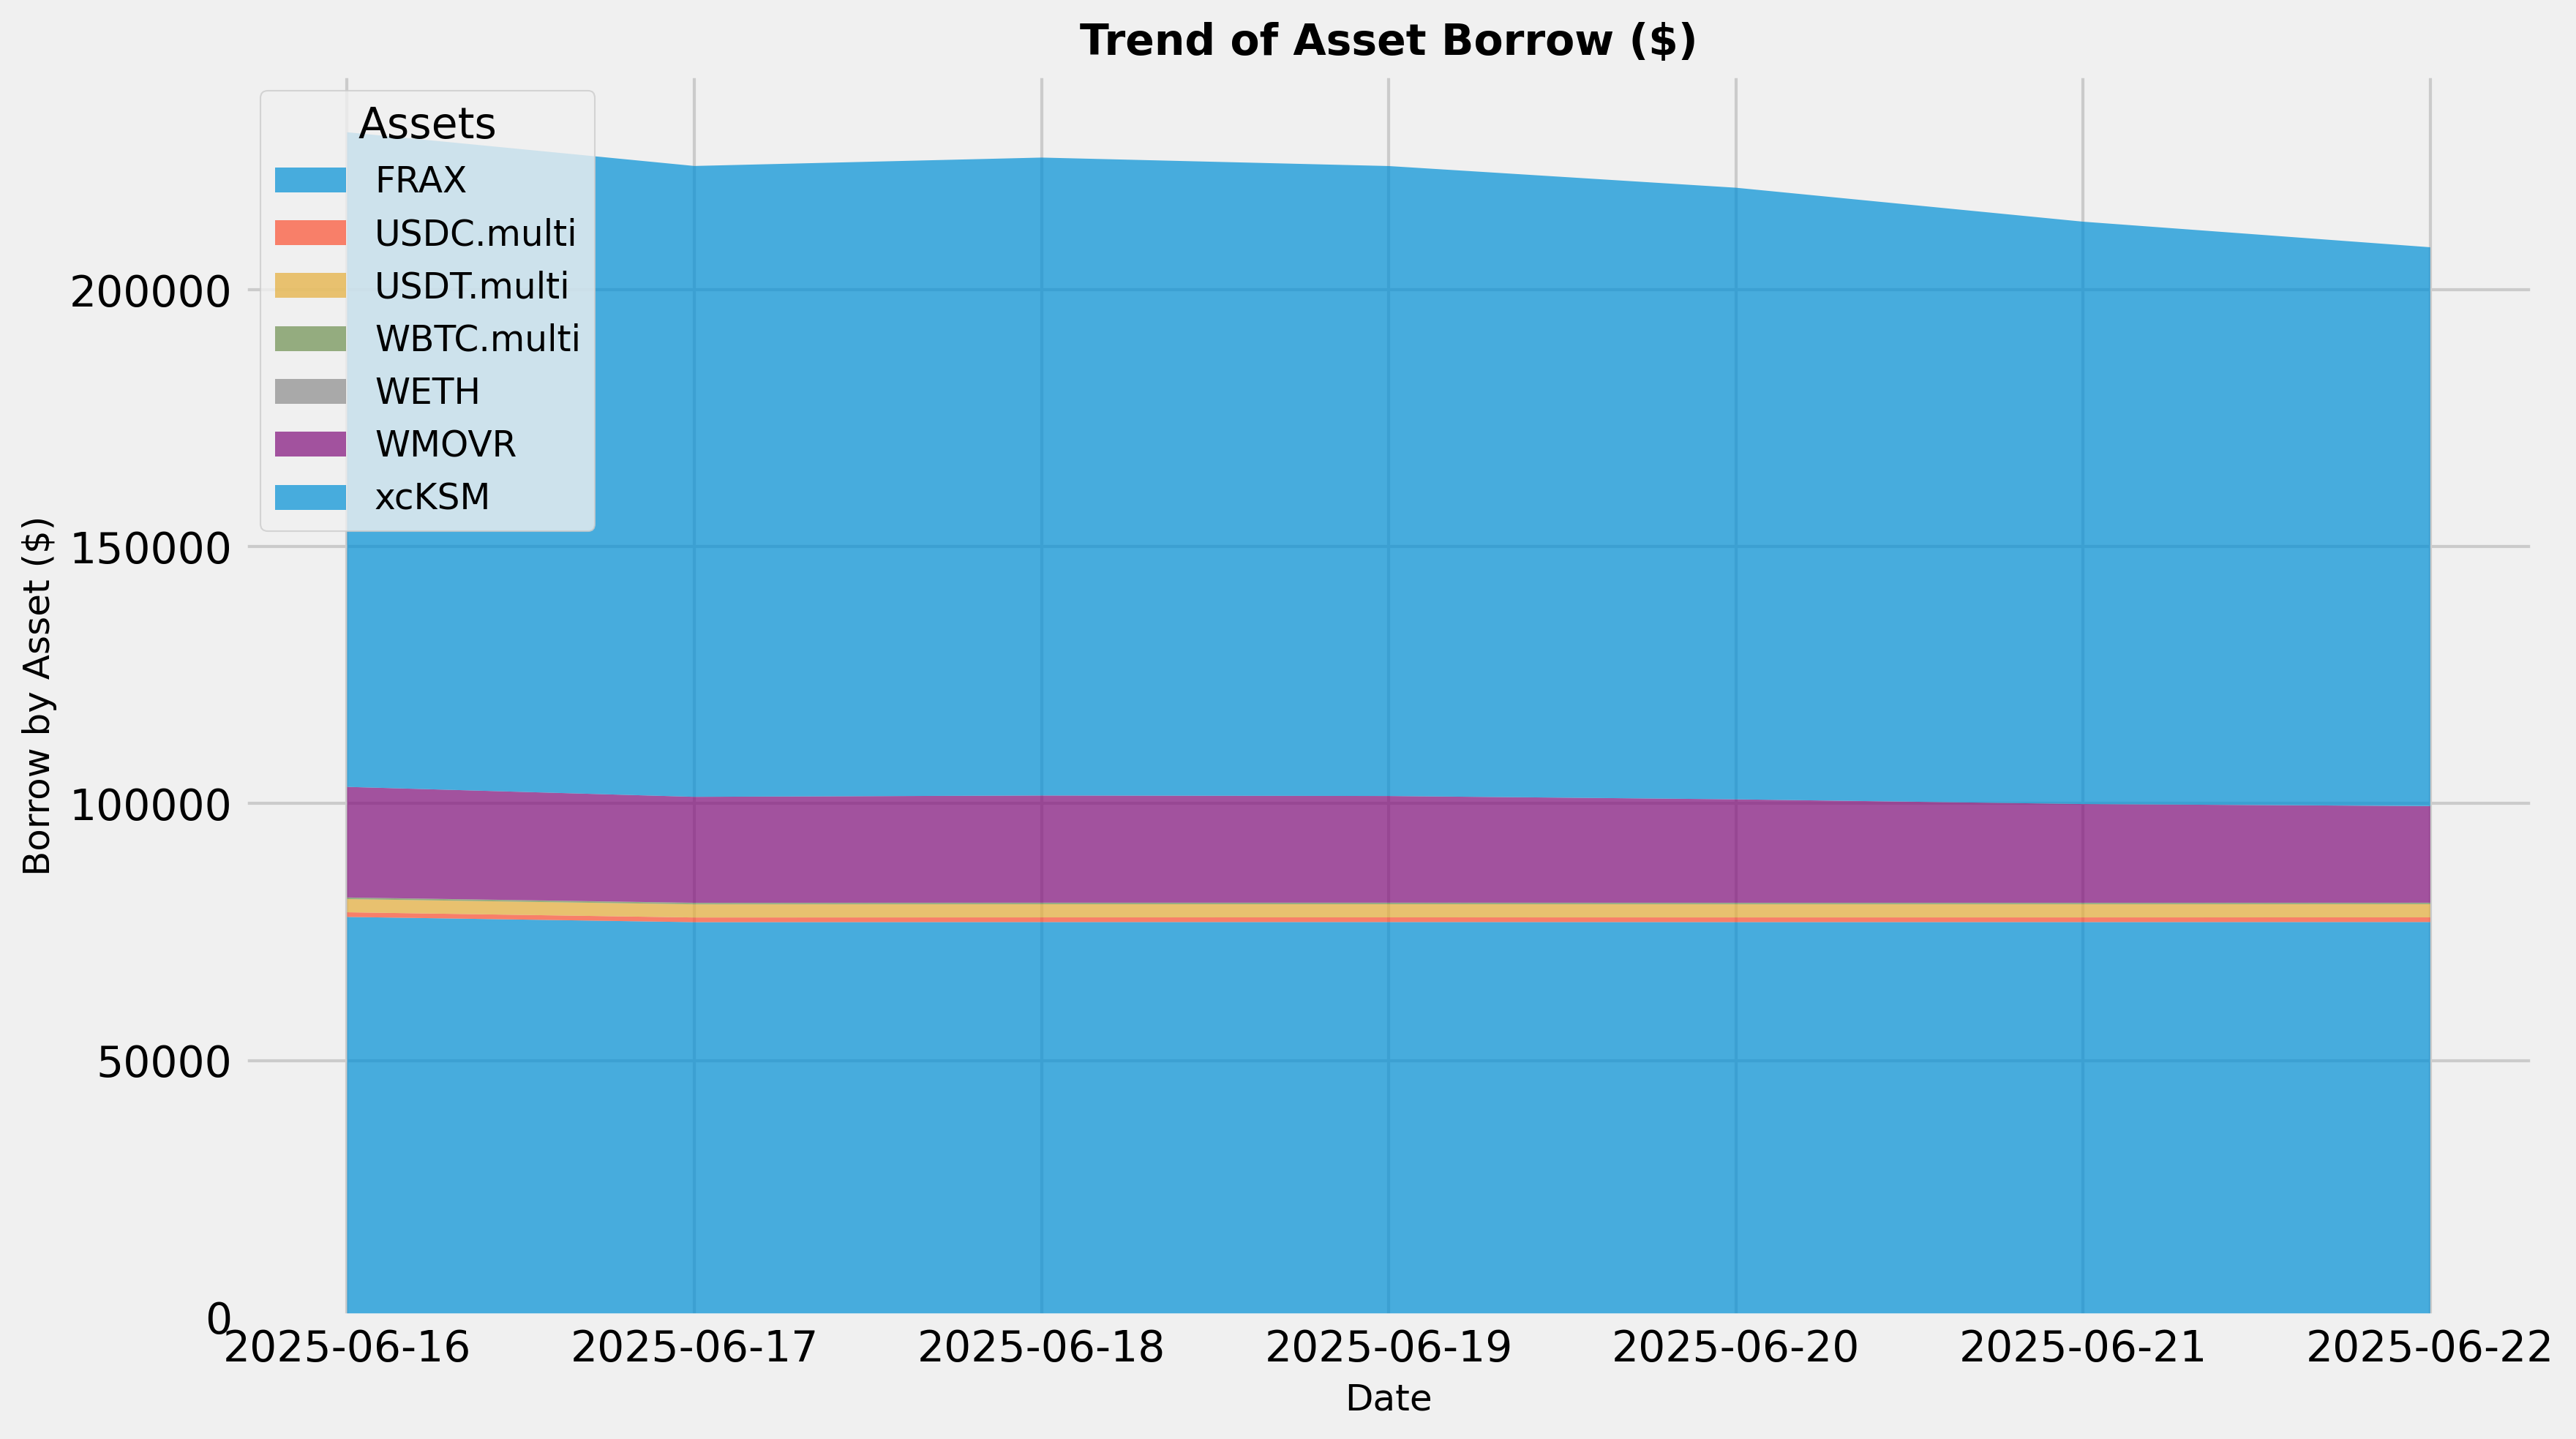
Borrows Trend
This graph shows the total borrows of all assets over the time frame in question. To see updated statistics, please see the live version of this graph here.
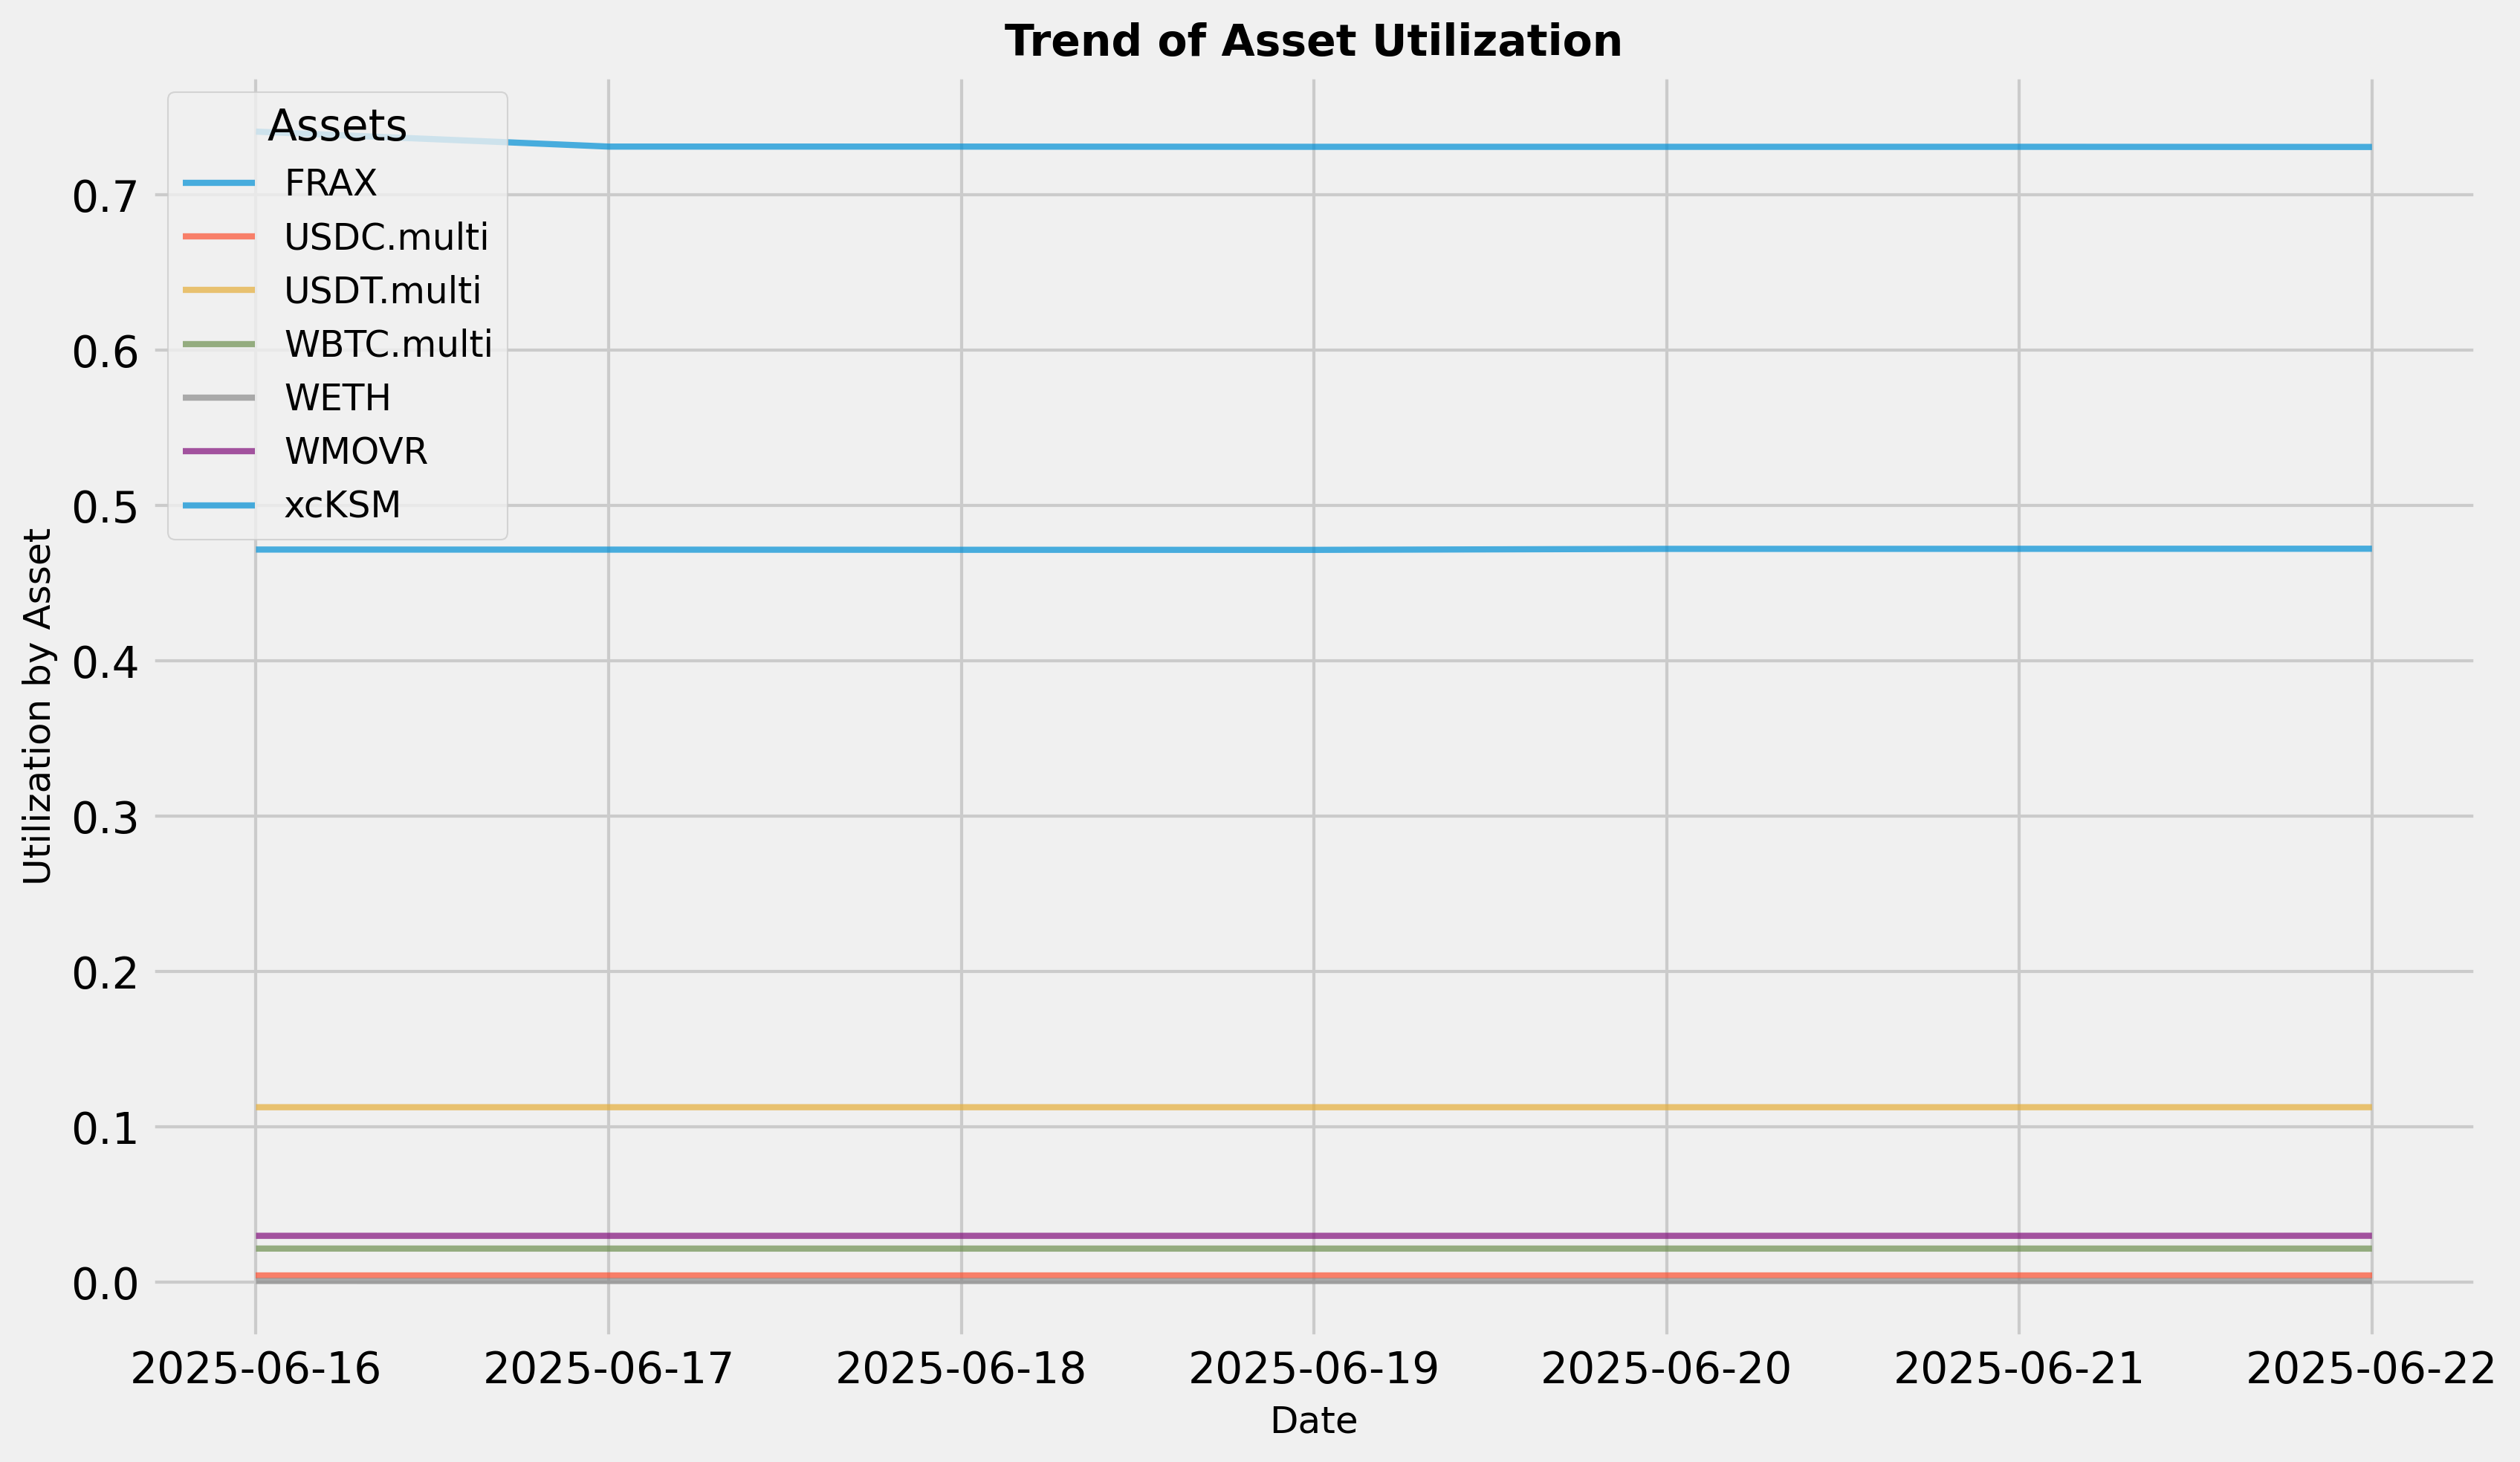
Utilization Trend
This graph shows the utilization (borrow / supply) of all assets over the time frame in question.
Borrow Cap Usage Trend
This graph shows the borrow cap usage (borrow / borrow cap) of all assets over the time frame in question.
