Jump to the most recent weekly update with this link:
monitoring dashboard .
[image1]
Asset
Current Borrow Cap
Current Supply Cap
Average Borrow Cap Usage (Past Week)
Average Supply Cap Usage (Past Week)
Average Utilization
cbETH
0.00
4.00K
0.00%
17.18%
100.00%
USDS
690.00K
750.00K
1.49%
…
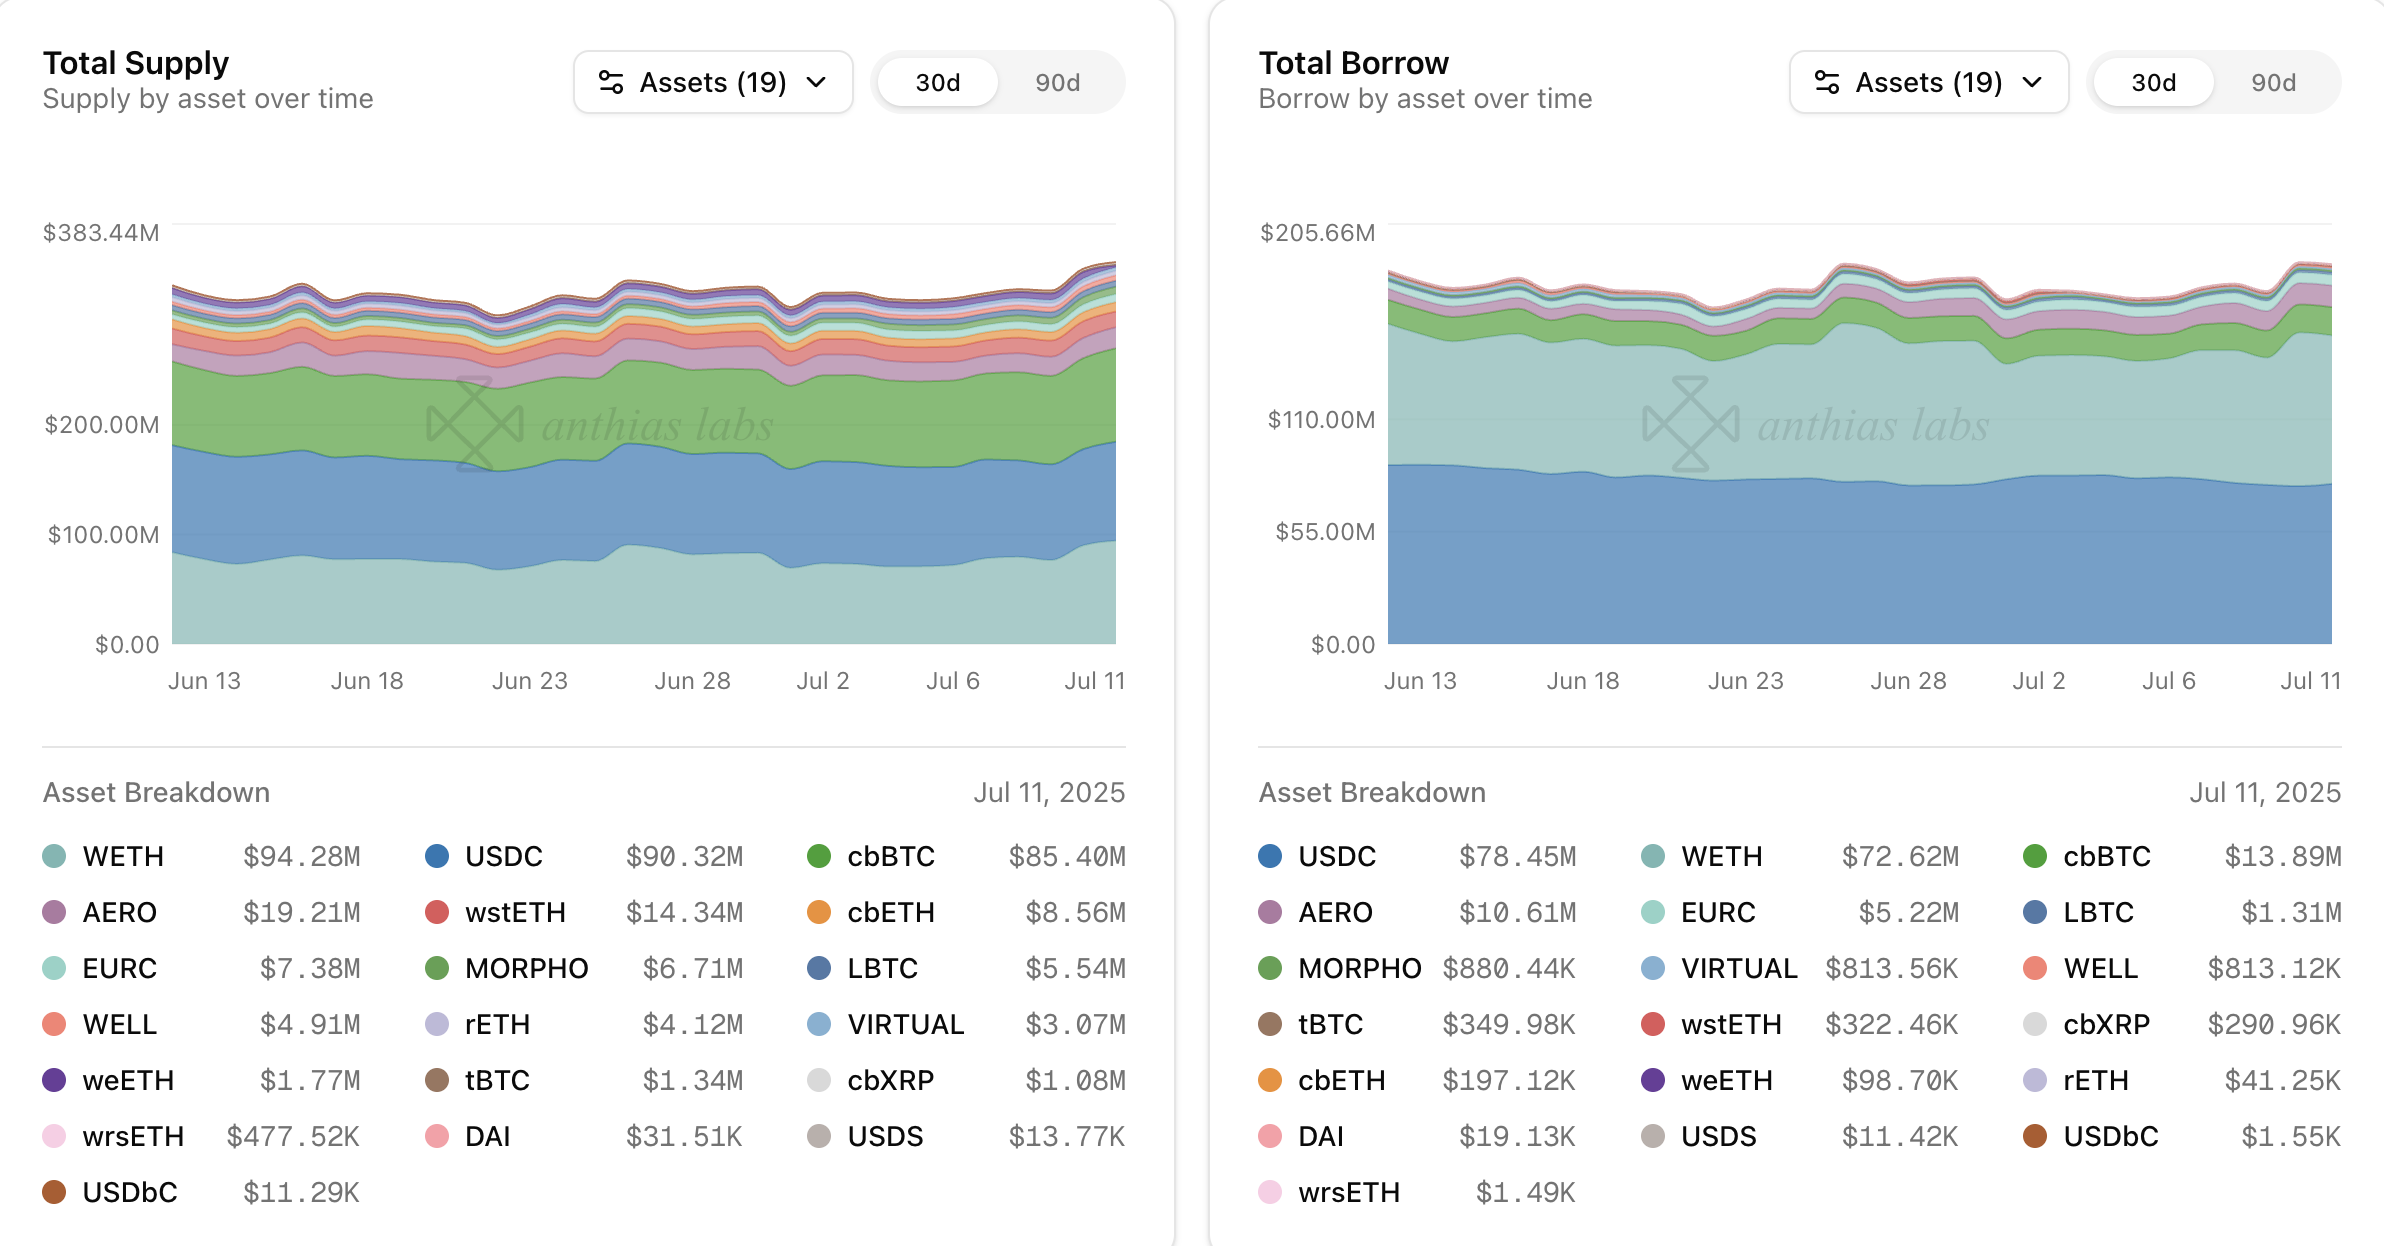
Anthias Labs would like to provide an update on market performance over the past week for Core markets on Base, Optimism, Moonbeam, and Moonriver. Data from 6/28/25 to 7/4/25.
Asset
Current Borrow Cap
Current Supply Cap
Average Borrow Cap Usage (Past Week)
Average Supply Cap Usage (Past Week)
Average Utilization
USDC
184.00M
200.00M
43.31%
45.74%
87.11%
WETH
64.00K
96.00K
40.10%
32.14%
82.99%
USDS
690.00K
750.00K
1.34%
1.51%
81.44%
EURC
21.00M
21.90M
18.74%
27.25%
65.95%
DAI
300.00K
400.00K
6.38%
7.97%
59.99%
AERO
25.00M
70.00M
45.20%
35.12%
46.08%
VIRTUAL
2.30M
4.50M
23.96%
38.91%
31.48%
cbXRP
500.00K
1.00M
13.87%
26.30%
27.02%
tBTC
36.00
90.00
8.72%
14.35%
24.32%
LBTC
38.00
95.00
29.96%
49.88%
24.01%
WELL
75.00M
150.00M
31.90%
86.86%
19.03%
MORPHO
1.00M
4.00M
51.47%
72.23%
18.06%
cbBTC
640.00
1.50K
18.17%
47.84%
16.20%
USDbC
1.00
1.00
155.04K%
1.21M%
12.86%
wstETH
4.80K
14.40K
5.13%
31.73%
5.39%
cbETH
6.40K
16.00K
1.34%
16.66%
3.22%
rETH
900.00
2.60K
2.58%
49.04%
1.82%
weETH
700.00
4.00K
4.52%
49.89%
1.58%
wrsETH
430.00
1.00K
0.17%
17.64%
0.42%
Asset
Total Borrow
Total Supply
Utilization
USDC
+4% from 79.75M USDC to 82.88M USDC
+0% from 92.48M USDC to 92.87M USDC
+3% from 86.24% to 89.24%
WETH
-26% from 31.25K WETH to 23.26K WETH
-22% from 36.47K WETH to 28.42K WETH
-4% from 85.68% to 81.86%
USDS
+1% from 9.16K USDS to 9.27K USDS
-1% from 11.38K USDS to 11.23K USDS
+3% from 80.49% to 82.54%
EURC
+5% from 3.92M EURC to 4.11M EURC
+5% from 5.85M EURC to 6.13M EURC
-0% from 67.00% to 66.93%
DAI
-3% from 19.43K DAI to 18.94K DAI
-2% from 32.37K DAI to 31.71K DAI
-1% from 60.03% to 59.71%
AERO
+39% from 8.97M AERO to 12.51M AERO
-5% from 25.25M AERO to 24.07M AERO
+46% from 35.53% to 51.97%
VIRTUAL
-29% from 582.50K VIRTUAL to 412.51K VIRTUAL
-3% from 1.76M VIRTUAL to 1.70M VIRTUAL
-27% from 33.16% to 24.31%
cbXRP
+17% from 11.65K cbXRP to 13.60K cbXRP
+20% from 238.99K cbXRP to 287.28K cbXRP
-3% from 4.87% to 4.73%
tBTC
-4% from 3.17 tBTC to 3.04 tBTC
-2% from 12.78 tBTC to 12.54 tBTC
-2% from 24.80% to 24.24%
LBTC
+8% from 11.14 LBTC to 12.01 LBTC
+4% from 46.89 LBTC to 48.66 LBTC
+4% from 23.77% to 24.68%
WELL
-38% from 26.61M WELL to 16.39M WELL
+45% from 99.05M WELL to 143.30M WELL -57% from 26.86% to 11.44%
MORPHO
+6% from 497.82K MORPHO to 526.08K MORPHO
+48% from 2.70M MORPHO to 4.00M MORPHO -29% from 18.47% to 13.15%
cbBTC
+1% from 115.89 cbBTC to 117.32 cbBTC
+1% from 719.15 cbBTC to 724.14 cbBTC
+1% from 16.11% to 16.20%
USDbC
+0% from 1.55K USDbC to 1.55K USDbC
-3% from 12.14K USDbC to 11.73K USDbC
+3% from 12.77% to 13.21%
wstETH
-65% from 259.09 wstETH to 90.15 wstETH -1% from 4.62K wstETH to 4.59K wstETH
-65% from 5.61% to 1.96%
cbETH
-19% from 89.15 cbETH to 72.57 cbETH
-1% from 2.68K cbETH to 2.66K cbETH
-18% from 3.33% to 2.73%
rETH
+0% from 23.22 rETH to 23.22 rETH
-5% from 1.29K rETH to 1.23K rETH
+5% from 1.80% to 1.89%
weETH
-5% from 32.92 weETH to 31.15 weETH
-0% from 2.00K weETH to 1.99K weETH
-5% from 1.65% to 1.57%
wrsETH
+6% from 0.57 wrsETH to 0.61 wrsETH
-46% from 278.35 wrsETH to 151.25 wrsETH +95% from 0.21% to 0.40%
AERO borrows up 39%, utilization from 35.53% to 51.97%
MORPHO supply up 48%, from 2.70M to 4.00M, supply cap maxed
VIRTUAL borrows down 29%, from 582.50K to 412.51K
WETH borrows down 26%, from 31.25K to 23.26K
WETH supply down 22%, from 36.47K to 28.42K
WELL borrows down 38%, from 26.61M to 16.39M
WELL supply up 45%, from 99.05M to 143.30M
wstETH borrows down 65%, from 259.09 to 90.15
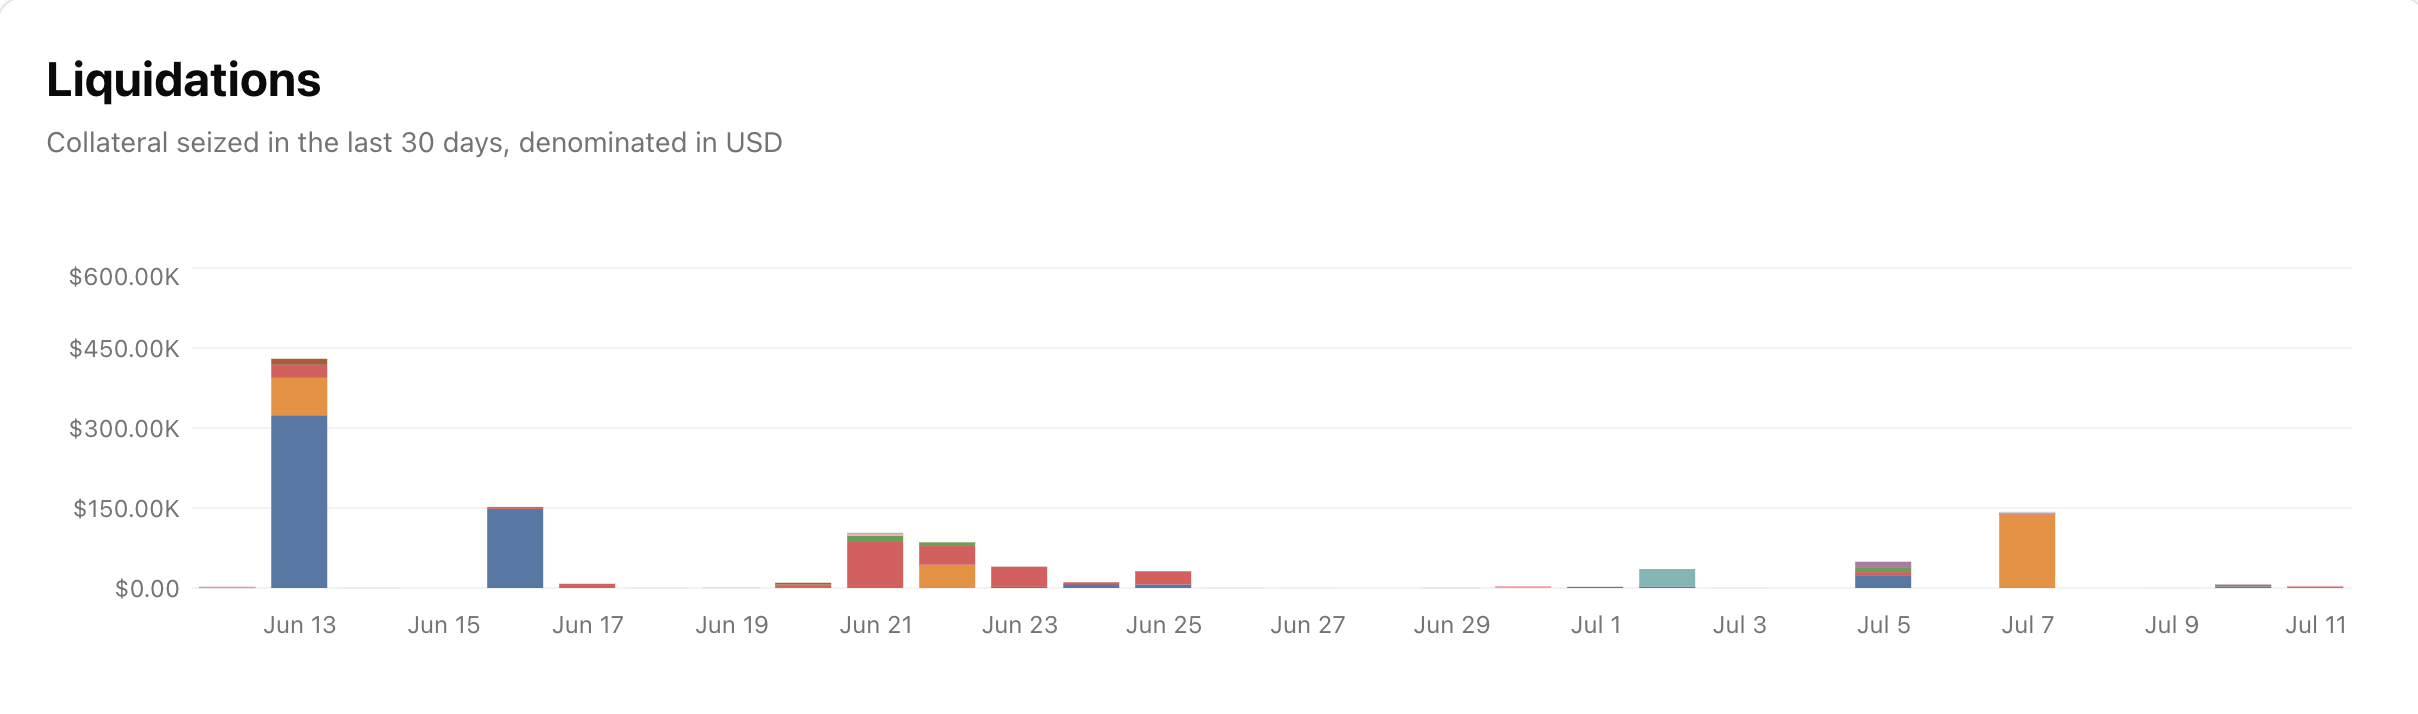
Total liquidations: 44Total Collateral Seized (USD): $41,962.43
Asset
Total Seized (Tokens)
Total Seized (USD)
Liquidation Count
weETH
12.887000
$32,793.90
1
USDC
5,429.562300
$5,429.27
10
VIRTUAL
2,243.349000
$3,450.45
2
AERO
253.619875
$202.20
5
WETH
0.018991
$46.25
24
cbBTC
0.000331
$35.46
1
WELL
190.263000
$4.90
1
Asset
Current Borrow Cap
Current Supply Cap
Average Borrow Cap Usage (Past Week)
Average Supply Cap Usage (Past Week)
Average Utilization
WETH
30.00K
32.00K
34.10%
36.41%
87.81%
DAI
4.50M
4.80M
7.78%
8.21%
87.80%
USDC
34.00M
36.40M
26.55%
29.15%
85.07%
USDT
18.40M
22.60M
1.61%
1.60%
78.67%
USDT0
8.00M
10.00M
32.24%
41.27%
63.52%
wrsETH
160.00
400.00
3.05%
8.80%
13.86%
rETH
340.00
750.00
3.07%
14.30%
9.74%
VELO
20.00M
68.00M
14.82%
57.08%
7.63%
OP
650.00K
5.60M
21.96%
44.84%
5.69%
wstETH
1.50K
5.00K
3.27%
20.00%
4.91%
WBTC
0.00
0.00
0.00%
0.00%
4.31%
weETH
220.00
1.20K
13.30%
99.90%
2.44%
cbETH
0.00
10.00
0.00%
9.01%
0.20%
Asset
Total Borrow
Total Supply
Utilization
WETH
+2% from 10.19K WETH to 10.40K WETH
+3% from 11.51K WETH to 11.88K WETH
-1% from 88.50% to 87.58%
DAI
+19% from 398.92K DAI to 472.98K DAI
+17% from 440.95K DAI to 517.19K DAI
+1% from 90.47% to 91.45%
USDC
+15% from 7.88M USDC to 9.03M USDC
+14% from 9.21M USDC to 10.51M USDC
+0% from 85.56% to 85.89%
USDT
-28% from 423.87K USDT to 306.50K USDT
-23% from 476.72K USDT to 368.95K USDT
-7% from 88.91% to 83.07%
USDT0
-5% from 2.67M USDT0 to 2.54M USDT0
-31% from 4.96M USDT0 to 3.42M USDT0
+38% from 53.86% to 74.29%
wrsETH
-22% from 5.49 wrsETH to 4.29 wrsETH
-0% from 35.20 wrsETH to 35.17 wrsETH
-22% from 15.60% to 12.20%
rETH
+13% from 10.21 rETH to 11.49 rETH
+2% from 106.29 rETH to 108.85 rETH
+10% from 9.60% to 10.56%
VELO
+19% from 2.52M VELO to 3.00M VELO
+1% from 38.71M VELO to 39.03M VELO
+18% from 6.52% to 7.68%
OP
+1% from 142.71K OP to 144.05K OP
+1% from 2.49M OP to 2.52M OP
-0% from 5.73% to 5.71%
wstETH
+1% from 48.99 wstETH to 49.24 wstETH
-1% from 1.02K wstETH to 1.01K wstETH
+2% from 4.81% to 4.89%
WBTC
0% from 0.00 WBTC to 0.00 WBTC
0% from 0.07 WBTC to 0.07 WBTC
0% from 4.31% to 4.31%
weETH
-66% from 40.45 weETH to 13.69 weETH +0% from 1.20K weETH to 1.20K weETH
-66% from 3.38% to 1.14%
cbETH
-91% from 0.00 cbETH to 0.00 cbETH -0% from 0.90 cbETH to 0.90 cbETH
-93% from 0.24% to 0.02%
weETH borrows down 66% (40.45 to 13.69), supply cap maxed
USDT0 supply down 31% (4.96M to 3.42M)
DAI utilization crossed 90% kink
No liquidation events on OP Mainnet this week.
Asset
Current Borrow Cap
Average Borrow Cap Usage (Past Week)
Average Supply Cap Usage (Past Week)
Average Utilization
GLMR
0.1
6419.58M%
0.00%
56.02%
xcUSDC
0.1
100.75M%
0.00%
39.65%
xcUSDT
0.1
92.72M%
0.00%
38.42%
USDC_wh
0.1
43.27M%
0.00%
34.86%
xcDOT
0.1
23.37M%
0.00%
4.27%
ETH_wh
0.1
1.44K%
0.00%
2.81%
FRAX
0.1
455.10K%
0.00%
0.82%
BTC_wh
0.1
10.01%
0.00%
0.80%
Asset
Total Borrow
Total Supply
Utilization
GLMR
+0% from 6.41M GLMR to 6.43M GLMR
-4% from 11.63M GLMR to 11.15M GLMR
+5% from 55.15% to 57.67%
xcUSDC
-0% from 100.87K xcUSDC to 100.64K xcUSDC
+0% from 254.03K xcUSDC to 254.10K xcUSDC
-0% from 39.71% to 39.61%
xcUSDT
-0% from 92.87K xcUSDT to 92.57K xcUSDT
-1% from 243.36K xcUSDT to 241.11K xcUSDT
+1% from 38.16% to 38.40%
USDC_wh
+0% from 43.17K USDC_wh to 43.33K USDC_wh
+2% from 121.48K USDC_wh to 124.44K USDC_wh
-2% from 35.53% to 34.82%
xcDOT
+0% from 23.37K xcDOT to 23.37K xcDOT
-1% from 551.12K xcDOT to 545.51K xcDOT
+1% from 4.24% to 4.28%
ETH_wh
-4% from 1.46 ETH_wh to 1.41 ETH_wh
-0% from 51.37 ETH_wh to 51.30 ETH_wh
-4% from 2.84% to 2.74%
FRAX
+0% from 455.09 FRAX to 455.10 FRAX
+12% from 50.32K FRAX to 56.32K FRAX
-11% from 0.90% to 0.81%
BTC_wh
+19% from 0.01 BTC_wh to 0.01 BTC_wh
-1% from 1.25 BTC_wh to 1.24 BTC_wh
+20% from 0.68% to 0.82%
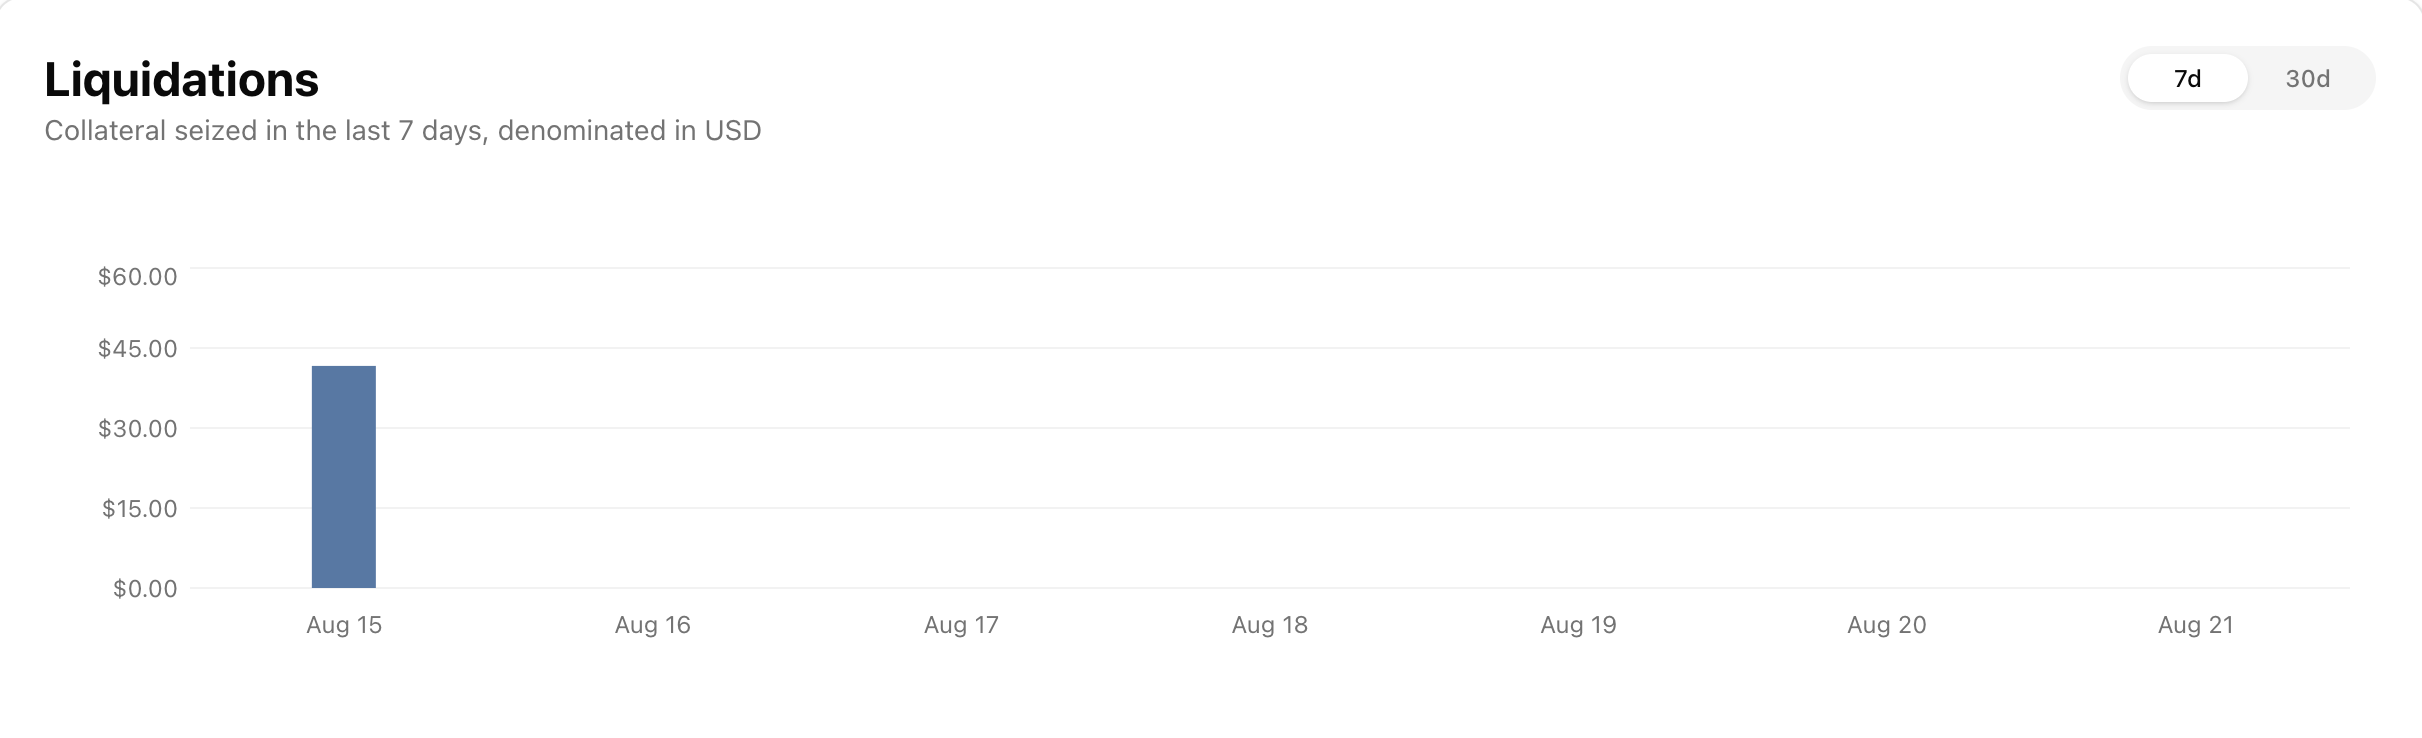
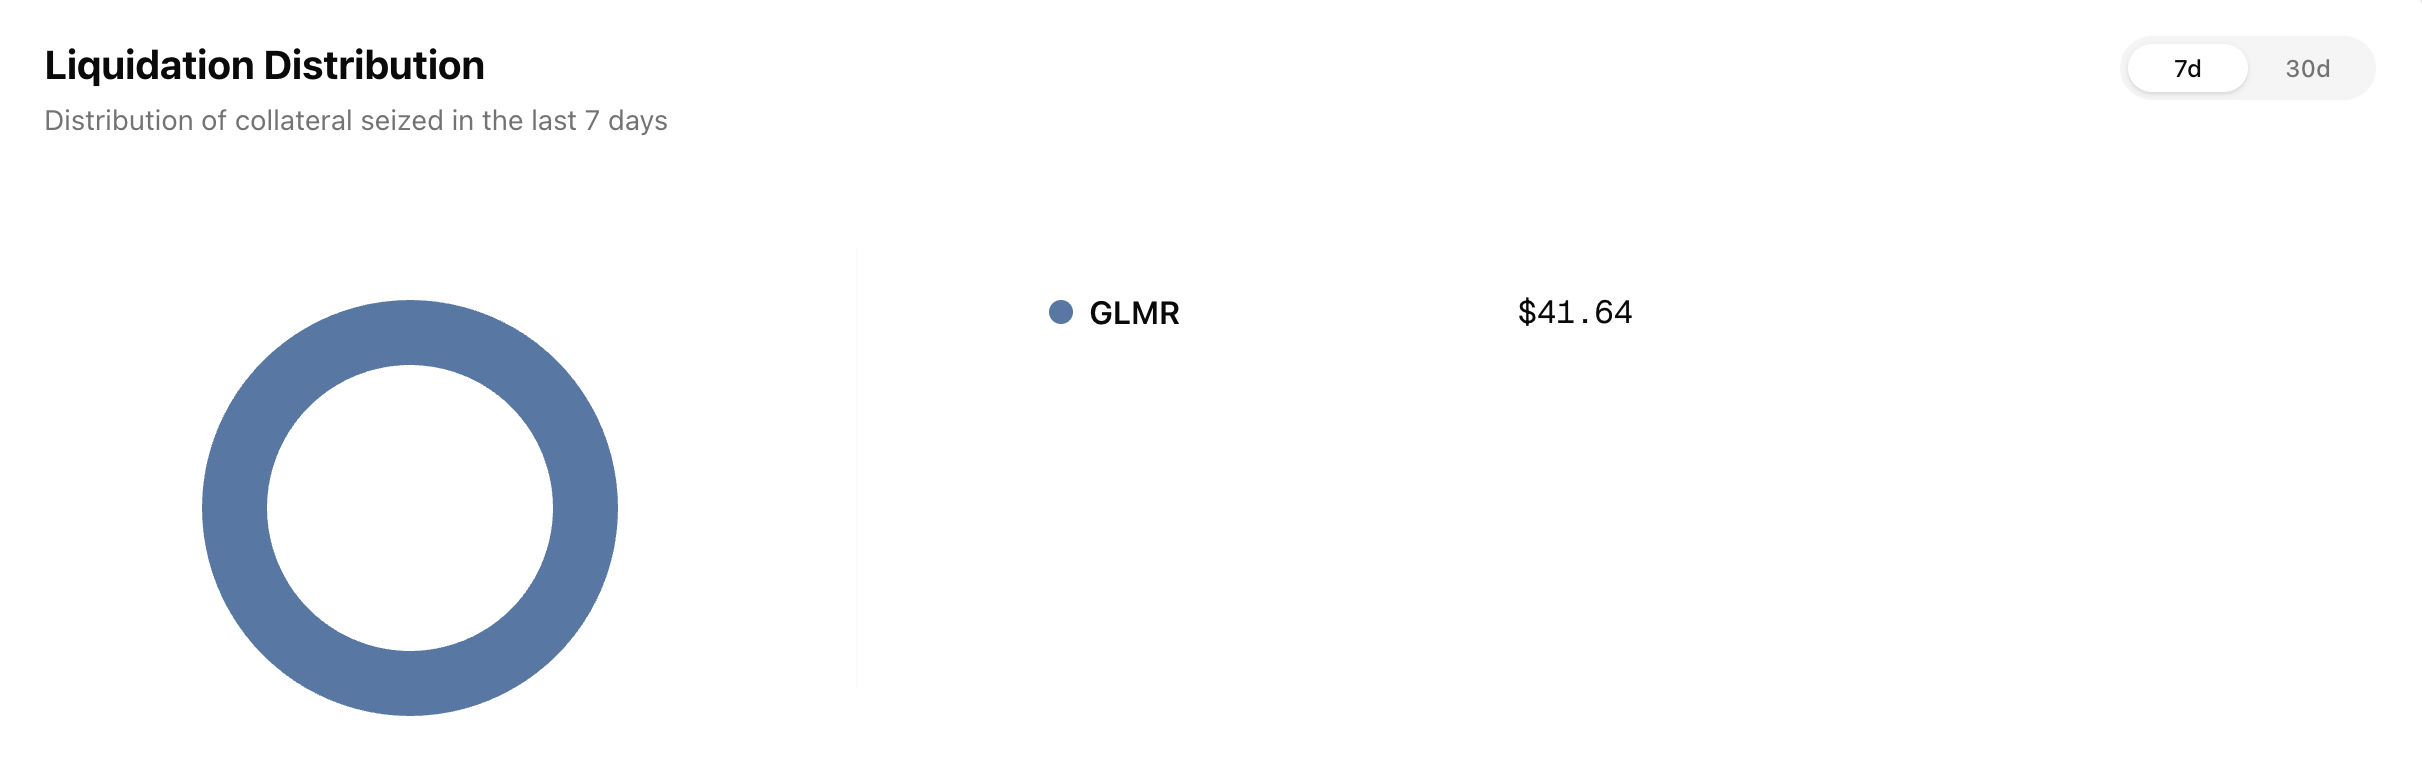
Total liquidations: 2Total Collateral Seized (USD): $41.58
Asset
Total Seized (Tokens)
Total Seized (USD)
Liquidation Count
xcDOT
11.191500
$38.05
1
GLMR
56.495400
$3.53
1
Asset
Current Borrow Cap
Average Borrow Cap Usage (Past Week)
Average Supply Cap Usage (Past Week)
Average Utilization
xcKSM
0.10
8.43M%
0.00%
41.27%
FRAX
0.10
76.85M%
0.00%
21.69%
MOVR
0.10
3.80M%
0.00%
2.51%
Asset
Total Borrow
Total Supply
Utilization
xcKSM
+0% from 8.43K xcKSM to 8.43K xcKSM
-2% from 20.42K xcKSM to 20.06K xcKSM
+2% from 41.27% to 42.01%
FRAX
-0% from 77.00K FRAX to 76.78K FRAX
-0% from 354.47K FRAX to 354.43K FRAX
-0% from 21.72% to 21.66%
MOVR
+0% from 3.80K MOVR to 3.80K MOVR
-1% from 151.26K MOVR to 150.43K MOVR
+1% from 2.51% to 2.53%
No liquidation events on Moonriver this week.
3 Likes
Anthias Labs would like to provide an update on market performance over the past week for Core markets on Base, Optimism, Moonbeam, and Moonriver. Data from 7/5/25 to 7/12/25. More information can be found on our monitoring dashboard: link .
Asset
Current Borrow Cap
Current Supply Cap
Average Borrow Cap Usage (Past Week)
Average Supply Cap Usage (Past Week)
Average Utilization
USDC
184.00M
200.00M
43.17%
44.58%
89.10%
USDS
690.00K
750.00K
1.46%
1.55%
86.90%
WETH
64.00K
96.00K
37.53%
30.92%
80.93%
EURC
21.00M
21.90M
20.12%
28.21%
68.42%
DAI
300.00K
400.00K
6.33%
7.90%
60.05%
AERO
25.00M
70.00M
52.83%
34.48%
54.71%
cbXRP
500.00K
1.00M
21.11%
34.23%
31.72%
VIRTUAL
2.30M
4.50M
23.86%
40.71%
29.84%
tBTC
36.00
90.00
8.43%
13.42%
25.18%
LBTC
38.00
95.00
28.69%
50.00%
22.95%
cbBTC
640.00
1.50K
18.74%
48.63%
16.44%
WELL
75.00M
150.00M
26.80%
97.74%
13.70%
MORPHO
1.00M
4.00M
53.22%
98.92%
13.45%
USDbC
1.00
1.00
155.05K%
1.16M%
13.38%
cbETH
6.40K
16.00K
1.08%
16.53%
2.62%
wstETH
4.80K
14.40K
1.93%
31.22%
2.06%
weETH
700.00
4.00K
4.45%
45.84%
2.02%
rETH
900.00
2.60K
2.35%
47.33%
1.72%
wrsETH
430.00
1.00K
0.15%
15.16%
0.42%
Asset
Total Borrow
Total Supply
Utilization
USDC
-5% from 82.75M USDC to 78.44M USDC
-3% from 92.52M USDC to 89.68M USDC
-2% from 89.44% to 87.47%
USDS
+27% from 9.27K USDS to 11.79K USDS
+23% from 11.23K USDS to 13.77K USDS
+4% from 82.54% to 85.63%
WETH
+10% from 23.31K WETH to 25.62K WETH
+13% from 28.42K WETH to 32.07K WETH
-3% from 82.03% to 79.87%
EURC
+26% from 4.05M EURC to 5.09M EURC
+3% from 6.27M EURC to 6.47M EURC
+22% from 64.66% to 78.75%
DAI
+1% from 18.94K DAI to 19.13K DAI
-1% from 31.71K DAI to 31.51K DAI
+2% from 59.71% to 60.71%
AERO
+3% from 12.24M AERO to 12.63M AERO
+0% from 24.07M AERO to 24.15M AERO
+3% from 50.84% to 52.30%
cbXRP
+0% from 109.42K cbXRP to 109.48K cbXRP
+52% from 287.48K cbXRP to 435.71K cbXRP -34% from 38.06% to 25.13%
VIRTUAL
+7% from 413.17K VIRTUAL to 440.19K VIRTUAL
+4% from 1.70M VIRTUAL to 1.77M VIRTUAL
+2% from 24.34% to 24.85%
tBTC
-21% from 3.04 tBTC to 2.40 tBTC
-12% from 12.63 tBTC to 11.08 tBTC
-10% from 24.06% to 21.67%
LBTC
+20% from 9.41 LBTC to 11.33 LBTC
+4% from 46.06 LBTC to 47.82 LBTC
+16% from 20.43% to 23.70%
cbBTC
+1% from 118.16 cbBTC to 119.24 cbBTC
+2% from 725.50 cbBTC to 742.98 cbBTC
-1% from 16.29% to 16.05%
WELL
+51% from 16.40M WELL to 24.82M WELL +4% from 143.49M WELL to 148.79M WELL
+46% from 11.43% to 16.68%
MORPHO
-0% from 526.06K MORPHO to 523.59K MORPHO
-1% from 4.00M MORPHO to 3.96M MORPHO
+1% from 13.15% to 13.23%
USDbC
+0% from 1.55K USDbC to 1.55K USDbC
-9% from 11.73K USDbC to 10.65K USDbC
+10% from 13.21% to 14.55%
cbETH
-17% from 72.67 cbETH to 60.38 cbETH
-2% from 2.66K cbETH to 2.61K cbETH
-15% from 2.73% to 2.32%
wstETH
+92% from 90.15 wstETH to 172.88 wstETH +6% from 4.60K wstETH to 4.85K wstETH
+82% from 1.96% to 3.57%
weETH
+0% from 31.15 weETH to 31.16 weETH
-72% from 1.99K weETH to 559.74 weETH +256% from 1.57% to 5.57%
rETH
-47% from 23.22 rETH to 12.24 rETH -1% from 1.23K rETH to 1.22K rETH
-47% from 1.88% to 1.00%
wrsETH
-21% from 0.61 wrsETH to 0.48 wrsETH
+2% from 151.25 wrsETH to 154.04 wrsETH
-22% from 0.40% to 0.31%
WELL borrows increased 51% from 16.4M to 24.82M WELL
wstETH borrows increased 92% from 90.15 to 172.88 wstETH
cbXRP supply increased 52% from 287.48K to 435.71K cbXRP
weETH supply decreased 72% from 1.99K to 559.74 weETH
Total liquidations: 71Total Collateral Seized (USD): $202,509.72
Asset
Total Seized (Tokens)
Total Seized (USD)
Liquidation Count
cbBTC
1.275812
$137,638.00
3
USDC
26,956.978949
$26,953.99
27
AERO
14,283.068200
$10,416.70
8
wstETH
3.288692
$10,020.54
3
WETH
3.802628
$9,551.61
21
LBTC
0.029133
$3,379.89
1
VIRTUAL
1,872.323000
$3,059.24
2
cbXRP
591.310000
$1,379.11
2
EURC
91.782930
$107.16
2
WELL
114.443000
$3.23
1
weETH
0.000077
$0.25
1
Asset
Current Borrow Cap
Current Supply Cap
Average Borrow Cap Usage (Past Week)
Average Supply Cap Usage (Past Week)
Average Utilization
WETH
30.00K
32.00K
34.43%
36.56%
88.30%
USDC
34.00M
36.40M
26.72%
28.68%
87.09%
DAI
4.50M
4.80M
6.96%
7.49%
85.64%
USDT
18.40M
22.60M
1.90%
1.82%
83.21%
USDT0
8.00M
10.00M
28.08%
29.75%
75.55%
wrsETH
160.00
400.00
2.66%
9.04%
11.79%
VELO
20.00M
68.00M
16.51%
58.54%
8.29%
rETH
340.00
750.00
3.38%
19.97%
7.69%
OP
650.00K
5.60M
24.36%
44.00%
6.43%
wstETH
1.50K
5.00K
3.60%
20.84%
5.18%
WBTC
0.00
0.00
0.00%
0.00%
4.31%
weETH
220.00
1.20K
5.96%
98.89%
1.11%
cbETH
0.00
10.00
0.00%
9.00%
0.02%
Asset
Total Borrow
Total Supply
Utilization
WETH
+4% from 10.40K WETH to 10.79K WETH
+4% from 11.88K WETH to 12.31K WETH
+0% from 87.57% to 87.69%
USDC
+20% from 9.03M USDC to 10.80M USDC
+19% from 10.51M USDC to 12.52M USDC
+0% from 85.89% to 86.28%
DAI
-30% from 473.01K DAI to 330.95K DAI
-26% from 518.77K DAI to 385.01K DAI
-6% from 91.18% to 85.96%
USDT
+76% from 306.50K USDT to 538.63K USDT +63% from 368.95K USDT to 599.92K USDT +8% from 83.07% to 89.78%
USDT0
-31% from 2.54M USDT0 to 1.76M USDT0
-36% from 3.41M USDT0 to 2.17M USDT0
+9% from 74.52% to 81.33%
wrsETH
-1% from 4.29 wrsETH to 4.26 wrsETH
+3% from 35.17 wrsETH to 36.26 wrsETH
-4% from 12.20% to 11.74%
VELO
+4% from 3.00M VELO to 3.12M VELO
+2% from 39.03M VELO to 39.87M VELO
+2% from 7.68% to 7.83%
rETH
+0% from 11.49 rETH to 11.50 rETH
+39% from 108.85 rETH to 150.91 rETH
-28% from 10.56% to 7.62%
OP
+11% from 145.05K OP to 161.50K OP
-1% from 2.49M OP to 2.46M OP
+13% from 5.83% to 6.56%
wstETH
+16% from 49.29 wstETH to 57.04 wstETH
+10% from 1.01K wstETH to 1.11K wstETH
+5% from 4.90% to 5.16%
WBTC
0% from 0.00 WBTC to 0.00 WBTC
0% from 0.07 WBTC to 0.07 WBTC
+0% from 4.31% to 4.32%
weETH
-35% from 13.69 weETH to 8.85 weETH
-1% from 1.20K weETH to 1.19K weETH
-35% from 1.14% to 0.74%
cbETH
0% from 0.00 cbETH to 0.00 cbETH
0% from 0.90 cbETH to 0.90 cbETH
+0% from 0.02% to 0.02%
USDT borrows increased 76% from 306.50K to 538.63K USDT
USDT supply increased 63% from 368.95K to 599.92K USDT
Total liquidations: 6Total Collateral Seized (USD): $17,425.71
Asset
Total Seized (Tokens)
Total Seized (USD)
Liquidation Count
USDT0
131.993058
$13,203.21
3
USDC
4,222.530000
$4,222.12
1
OP
5,207,780,000.000000
$0.27
1
WETH
0.000045
$0.12
1
Asset
Current Borrow Cap
Current Supply Cap
Average Borrow Cap Usage (Past Week)
Average Utilization
GLMR
0.10
0.00
6444.00M%
58.51%
xcUSDC
0.10
0.00
100.34M%
38.61%
xcUSDT
0.10
0.00
90.79M%
37.21%
USDC_wh
0.10
0.00
43.27M%
34.75%
xcDOT
0.10
0.00
23.37M%
4.27%
ETH_wh
0.10
0.00
1.39K%
2.71%
FRAX
0.10
0.00
455.11K%
0.80%
BTC_wh
0.10
0.00
9.28%
0.74%
Asset
Total Borrow
Total Supply
Utilization
GLMR
+0% from 6.43M GLMR to 6.46M GLMR
-6% from 11.15M GLMR to 10.49M GLMR
+7% from 57.67% to 61.61%
xcUSDC
-1% from 100.64K xcUSDC to 99.97K xcUSDC
+5% from 254.10K xcUSDC to 267.72K xcUSDC
-6% from 39.61% to 37.34%
xcUSDT
-7% from 92.57K xcUSDT to 85.73K xcUSDT
+18% from 241.11K xcUSDT to 283.53K xcUSDT
-21% from 38.40% to 30.24%
USDC_wh
-1% from 43.33K USDC_wh to 42.92K USDC_wh
+0% from 124.44K USDC_wh to 124.61K USDC_wh
-1% from 34.82% to 34.44%
xcDOT
-0% from 23.37K xcDOT to 23.37K xcDOT
+1% from 545.51K xcDOT to 548.51K xcDOT
-1% from 4.28% to 4.26%
ETH_wh
-2% from 1.41 ETH_wh to 1.37 ETH_wh
+0% from 51.30 ETH_wh to 51.30 ETH_wh
-2% from 2.74% to 2.68%
FRAX
+0% from 455.10 FRAX to 455.12 FRAX
-10% from 56.32K FRAX to 50.52K FRAX
+11% from 0.81% to 0.90%
BTC_wh
-34% from 0.01 BTC_wh to 0.01 BTC_wh
0% from 1.24 BTC_wh to 1.24 BTC_wh
-34% from 0.82% to 0.54%
Total liquidations: 2Total Collateral Seized (USD): $38.59
Asset
Total Seized (Tokens)
Total Seized (USD)
Liquidation Count
GLMR
567.755860
$38.59
2
Asset
Current Borrow Cap
Current Supply Cap
Average Borrow Cap Usage (Past Week)
Average Utilization
xcKSM
0.10
0.00
6.89M%
37.18%
FRAX
0.10
0.00
76.87M%
23.78%
MOVR
0.10
0.00
3.80M%
2.53%
Asset
Total Borrow
Total Supply
Utilization
xcKSM
-20% from 8.43K xcKSM to 6.78K xcKSM
-10% from 20.06K xcKSM to 18.15K xcKSM
-11% from 42.01% to 37.34%
FRAX
+0% from 76.78K FRAX to 77.03K FRAX
-9% from 354.43K FRAX to 321.42K FRAX
+11% from 21.66% to 23.96%
MOVR
+0% from 3.80K MOVR to 3.80K MOVR
+0% from 150.43K MOVR to 150.47K MOVR
-0% from 2.53% to 2.53%
No liquidations on Moonriver this week.
2 Likes
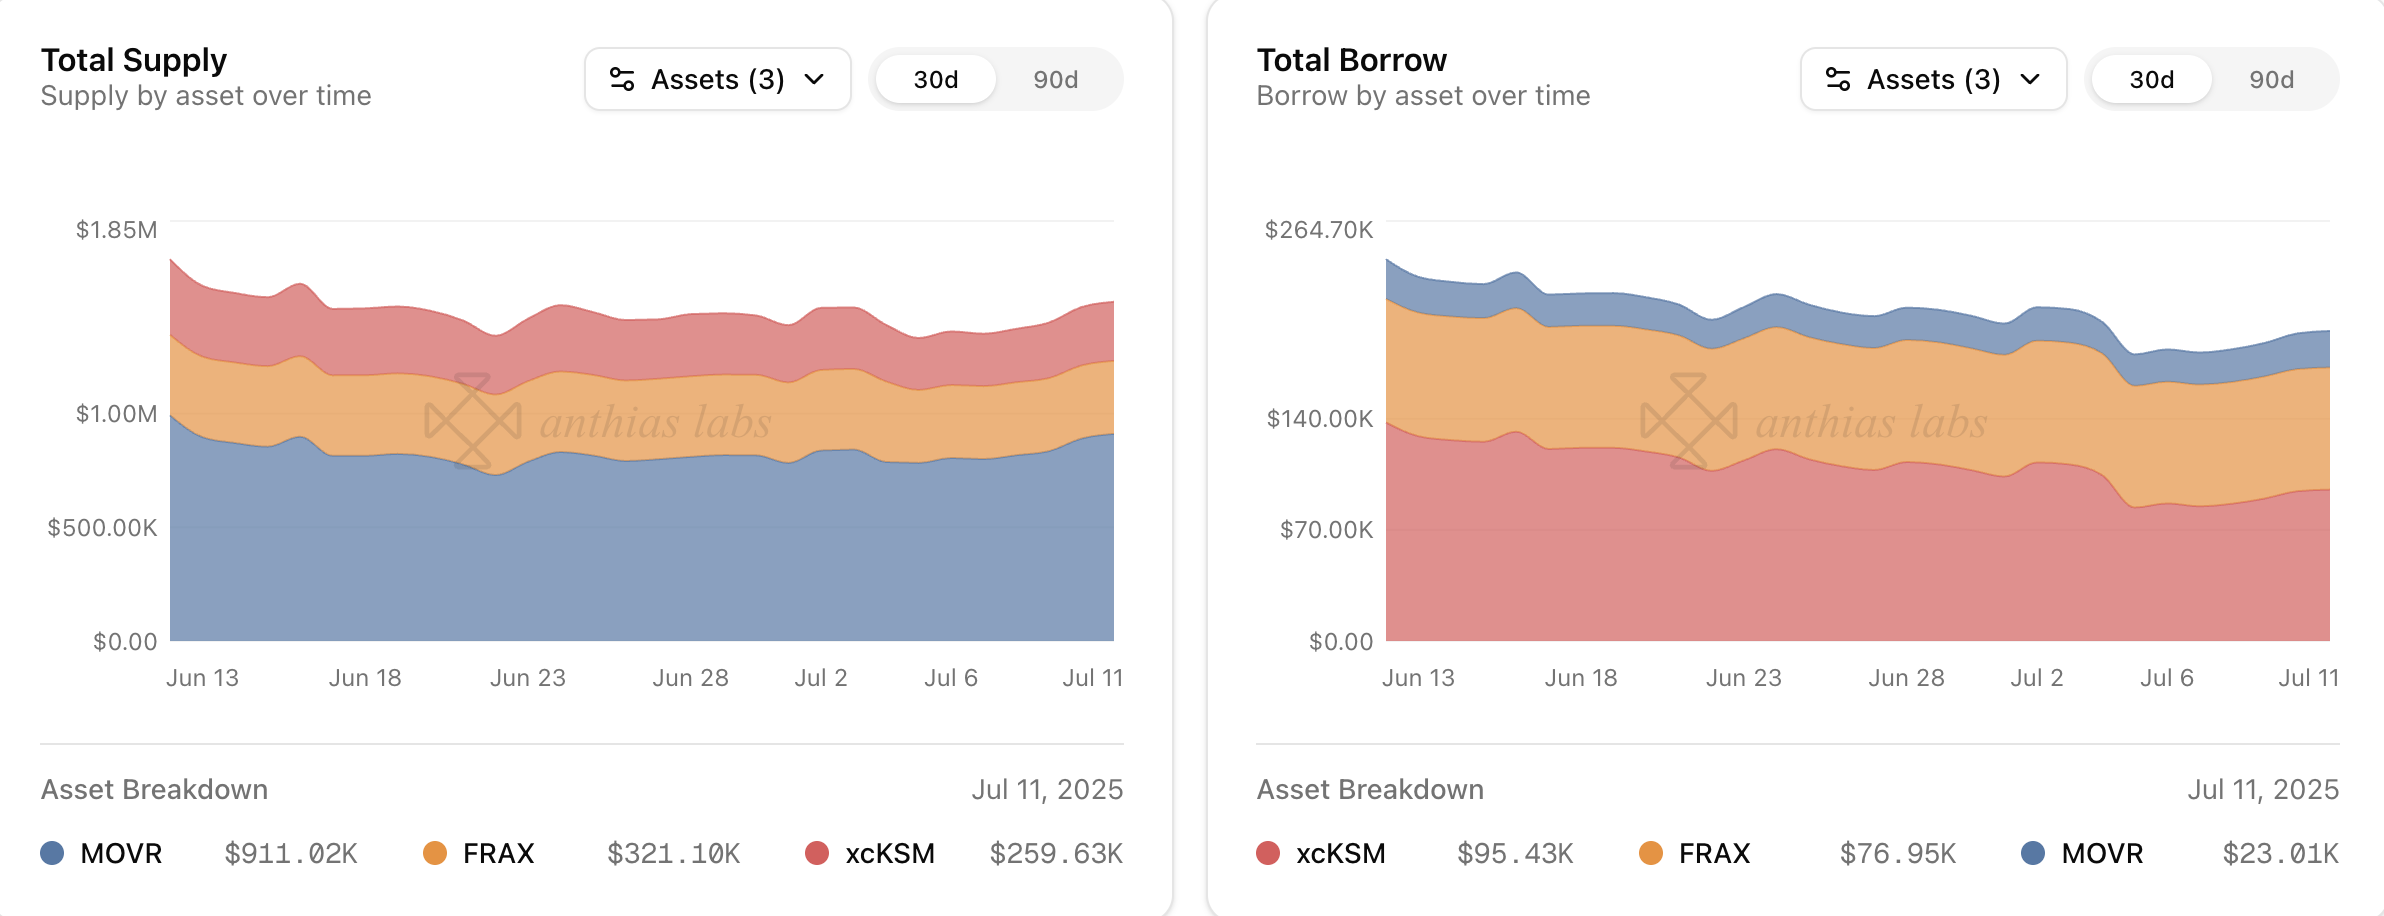
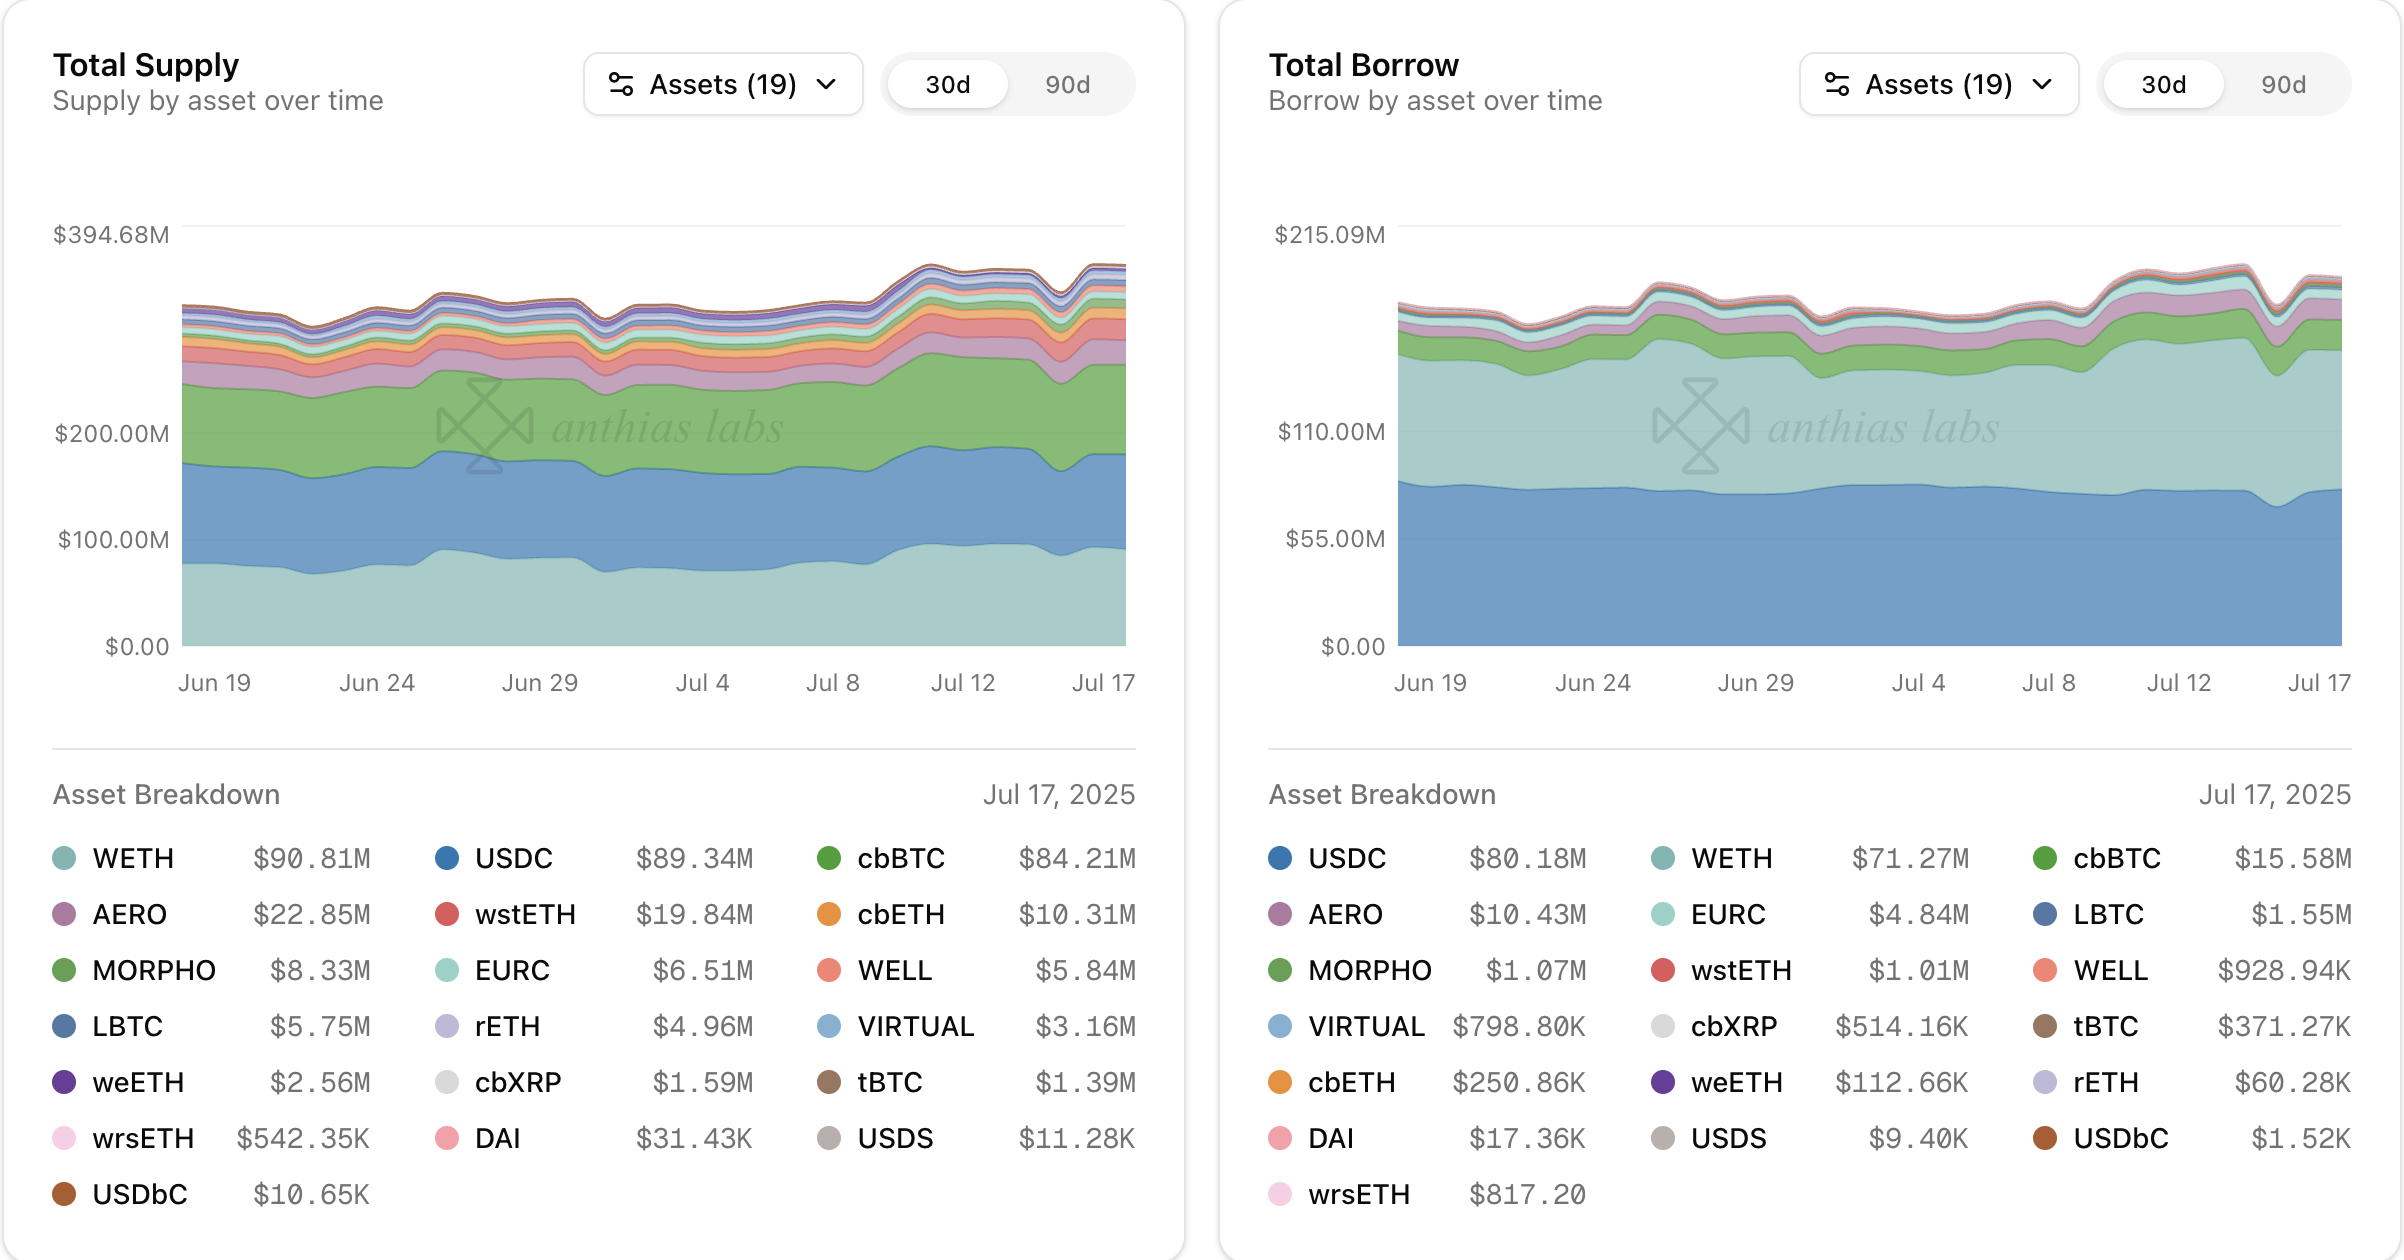
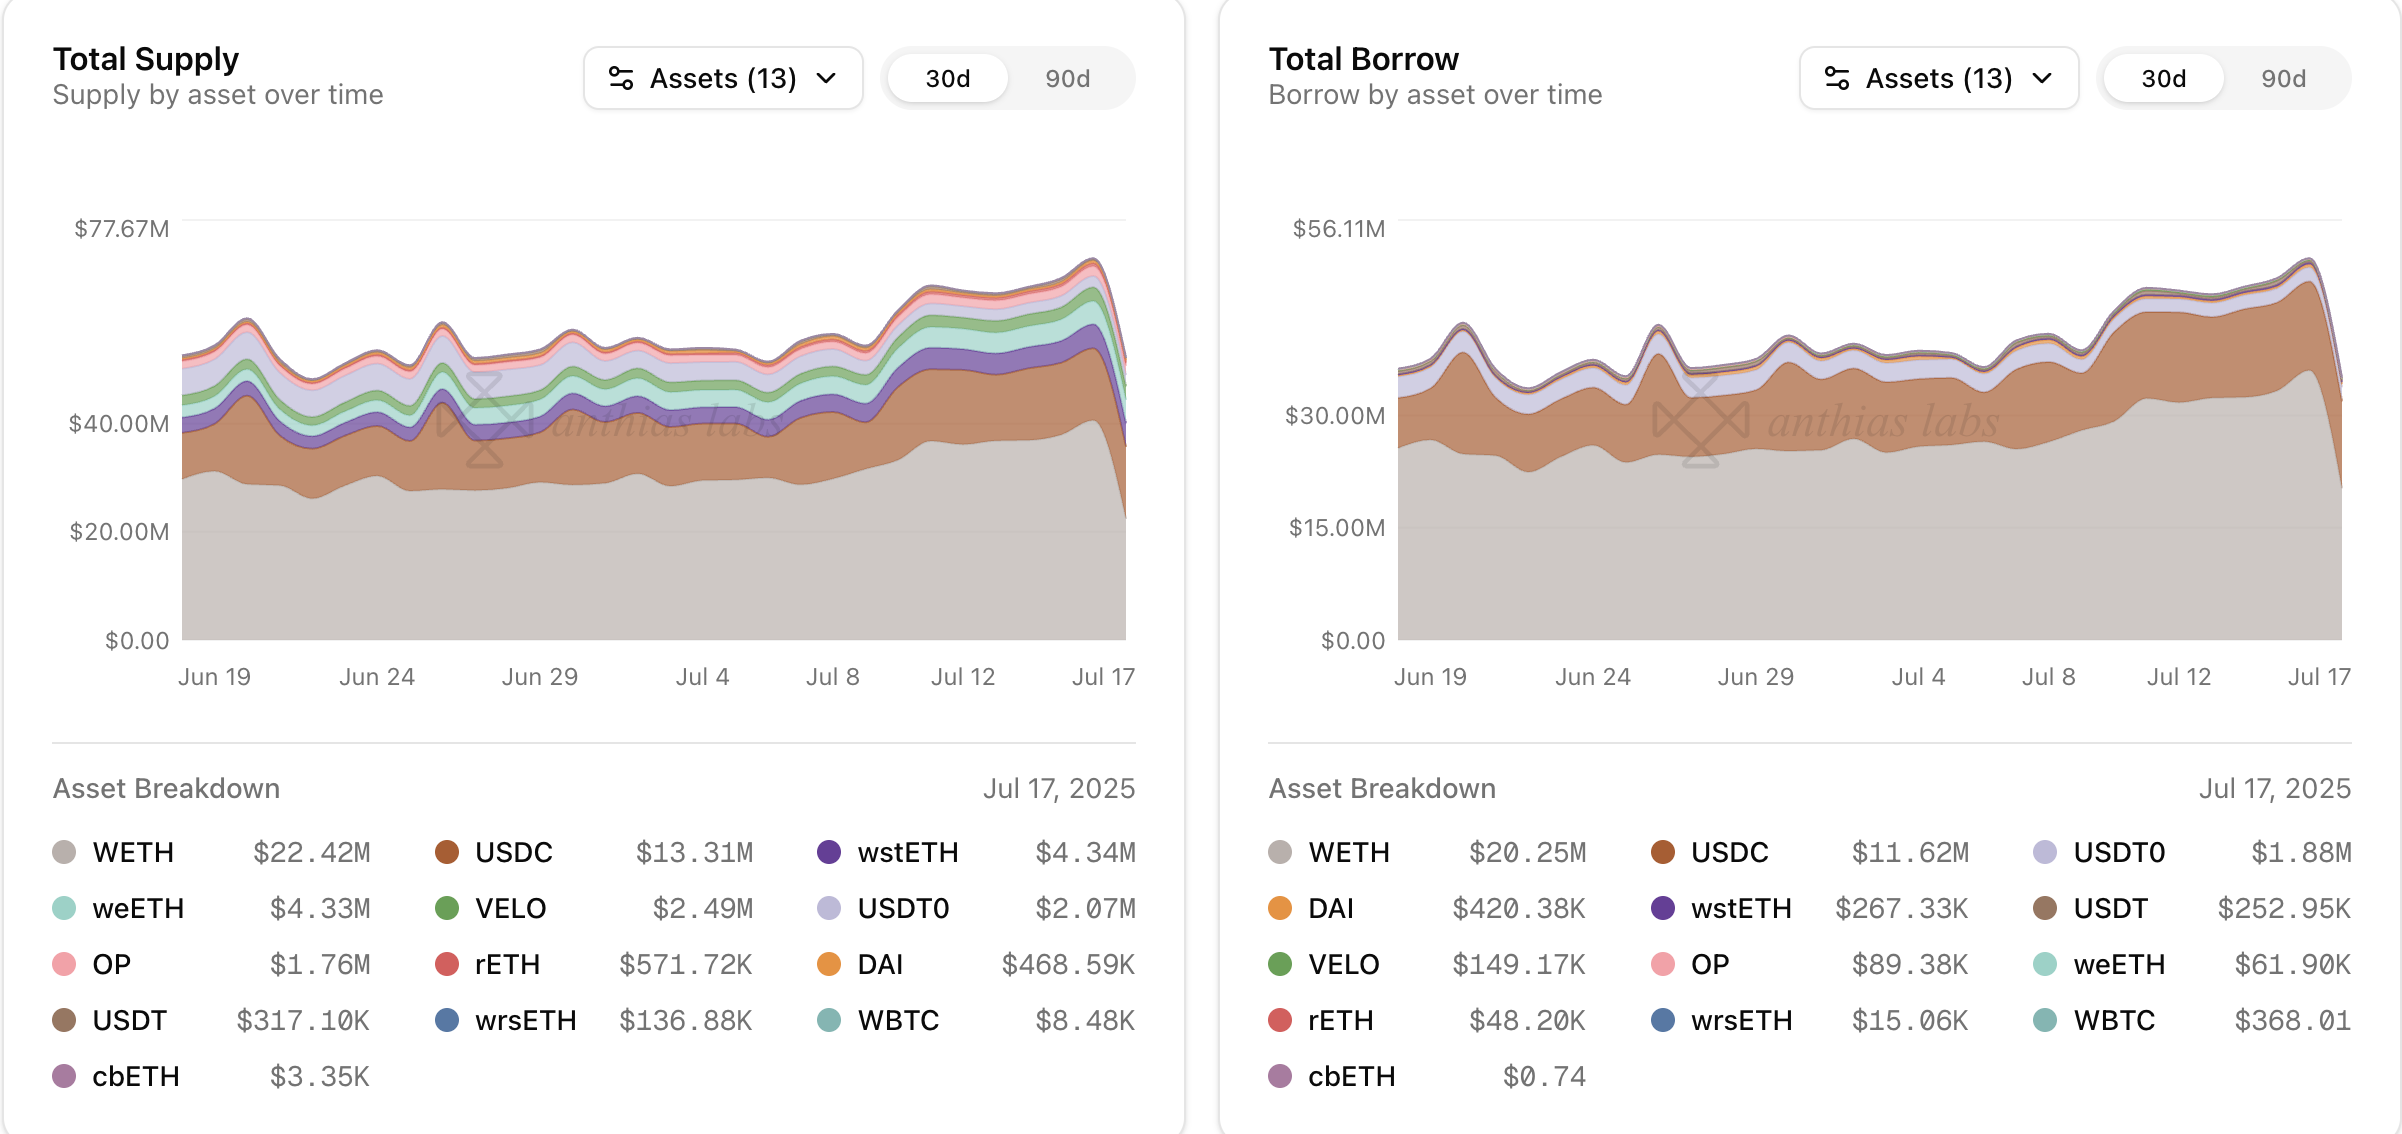
Anthias Labs would like to provide an update on market performance over the past week for Core markets on Base, Optimism, Moonbeam, and Moonriver. Data from 7/11/25 to 7/17/25. More information can be found on our monitoring dashboard .
Asset
Current Borrow Cap
Current Supply Cap
Average Borrow Cap Usage (Past Week)
Average Supply Cap Usage (Past Week)
Average Utilization
USDC
184.00M
200.00M
42.72%
44.41%
88.53%
USDS
690.00K
750.00K
1.47%
1.63%
83.00%
WETH
64.00K
96.00K
38.22%
31.86%
79.94%
EURC
21.00M
21.90M
22.19%
27.47%
77.41%
DAI
300.00K
400.00K
6.12%
7.87%
58.32%
AERO
25.00M
70.00M
50.60%
34.78%
51.97%
VIRTUAL
2.30M
4.50M
24.39%
39.54%
31.53%
cbXRP
500.00K
1.00M
26.35%
46.56%
28.27%
LBTC
38.00
95.00
30.90%
50.46%
24.49%
tBTC
36.00
90.00
7.51%
12.61%
23.87%
WELL
75.00M
150.00M
35.40%
99.26%
17.83%
cbBTC
640.00
1.50K
19.34%
47.84%
17.27%
USDbC
1.00
1.00
153.23K%
1.07M%
14.32%
MORPHO
1.00M
4.00M
52.02%
99.06%
13.13%
weETH
700.00
4.00K
4.39%
15.74%
5.03%
wstETH
4.80K
14.40K
4.47%
33.39%
4.44%
cbETH
6.40K
16.00K
1.00%
16.53%
2.41%
rETH
900.00
2.60K
1.41%
49.11%
1.00%
wrsETH
430.00
1.00K
0.10%
15.37%
0.28%
Asset
Total Borrow
Total Supply
Utilization
USDC
+1% from 77.31M USDC to 78.45M USDC
-1% from 87.90M USDC to 87.28M USDC
+2% from 87.95% to 89.89%
USDS
-14% from 10.96K USDS to 9.40K USDS
-18% from 13.77K USDS to 11.29K USDS
+5% from 79.60% to 83.32%
WETH
-19% from 26.67K WETH to 21.53K WETH
-16% from 31.92K WETH to 26.82K WETH
-4% from 83.54% to 80.29%
EURC
-9% from 4.39M EURC to 3.98M EURC
-8% from 6.12M EURC to 5.64M EURC
-2% from 71.68% to 70.53%
DAI
-9% from 19.14K DAI to 17.40K DAI
-0% from 31.53K DAI to 31.43K DAI
-9% from 60.70% to 55.35%
AERO
-20% from 13.82M AERO to 11.09M AERO
+1% from 24.30M AERO to 24.45M AERO
-20% from 56.85% to 45.35%
VIRTUAL
-15% from 485.49K VIRTUAL to 412.62K VIRTUAL
-5% from 1.85M VIRTUAL to 1.76M VIRTUAL
-11% from 26.29% to 23.41%
cbXRP
+46% from 108.88K cbXRP to 159.04K cbXRP +35% from 428.00K cbXRP to 579.34K cbXRP
+8% from 25.44% to 27.45%
LBTC
+28% from 11.33 LBTC to 14.45 LBTC
+4% from 47.84 LBTC to 49.86 LBTC
+22% from 23.69% to 28.98%
tBTC
+1% from 3.02 tBTC to 3.05 tBTC
+9% from 11.57 tBTC to 12.62 tBTC
-8% from 26.13% to 24.15%
WELL
+16% from 24.50M WELL to 28.49M WELL
+3% from 145.66M WELL to 149.49M WELL
+13% from 16.82% to 19.06%
cbBTC
+10% from 121.32 cbBTC to 133.13 cbBTC
-3% from 732.51 cbBTC to 709.63 cbBTC
+13% from 16.56% to 18.76%
USDbC
-2% from 1.55K USDbC to 1.52K USDbC
-6% from 11.29K USDbC to 10.64K USDbC
+4% from 13.74% to 14.27%
MORPHO
-5% from 538.77K MORPHO to 509.45K MORPHO
+1% from 3.95M MORPHO to 4.00M MORPHO
-7% from 13.64% to 12.73%
weETH
+0% from 31.16 weETH to 31.23 weETH
-65% from 2.00K weETH to 709.40 weETH +183% from 1.56% to 4.40%
wstETH
+0% from 88.32 wstETH to 88.74 wstETH
+16% from 4.49K wstETH to 5.21K wstETH
-13% from 1.97% to 1.70%
cbETH
+9% from 60.43 cbETH to 65.57 cbETH
+5% from 2.63K cbETH to 2.76K cbETH
+3% from 2.30% to 2.37%
rETH
+28% from 12.24 rETH to 15.71 rETH
+6% from 1.22K rETH to 1.29K rETH
+21% from 1.00% to 1.22%
wrsETH
-69% from 0.75 wrsETH to 0.23 wrsETH +1% from 152.77 wrsETH to 153.64 wrsETH
-69% from 0.49% to 0.15%
46% increase in cbXRP borrows from 108.88K to 159.04K cbXRP
35% increase in cbXRP supply from 428.00K to 579.34K cbXRP
65% decrease in weETH supply from 2.00K to 709.40 weETH
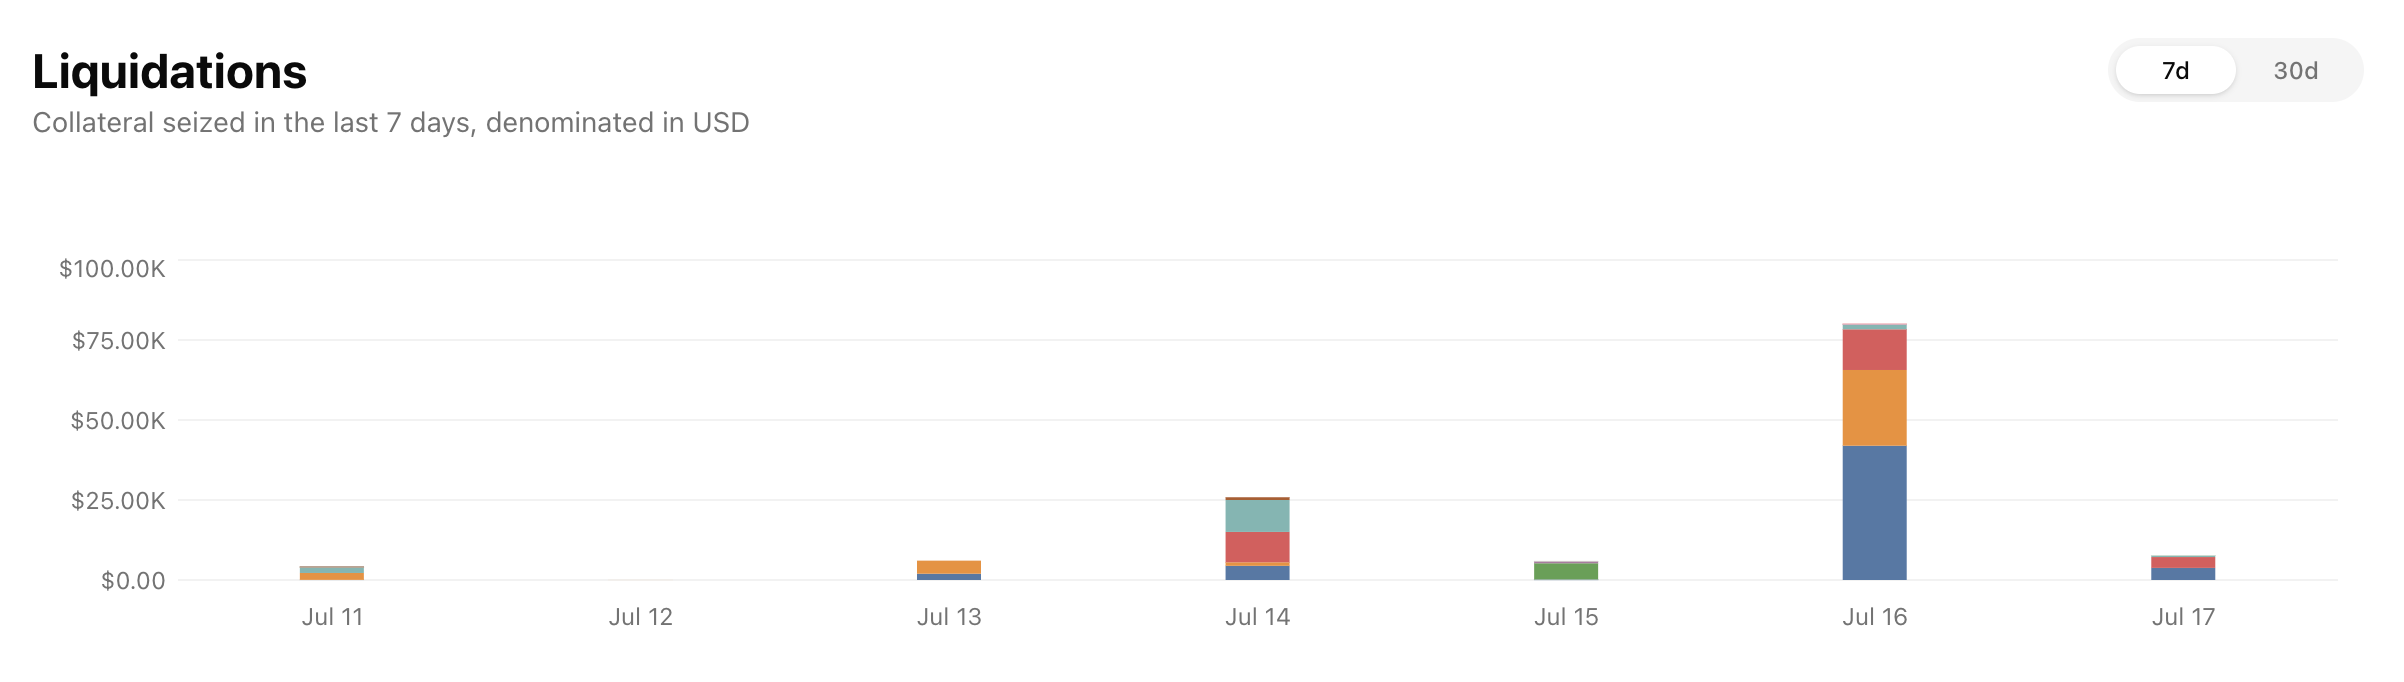
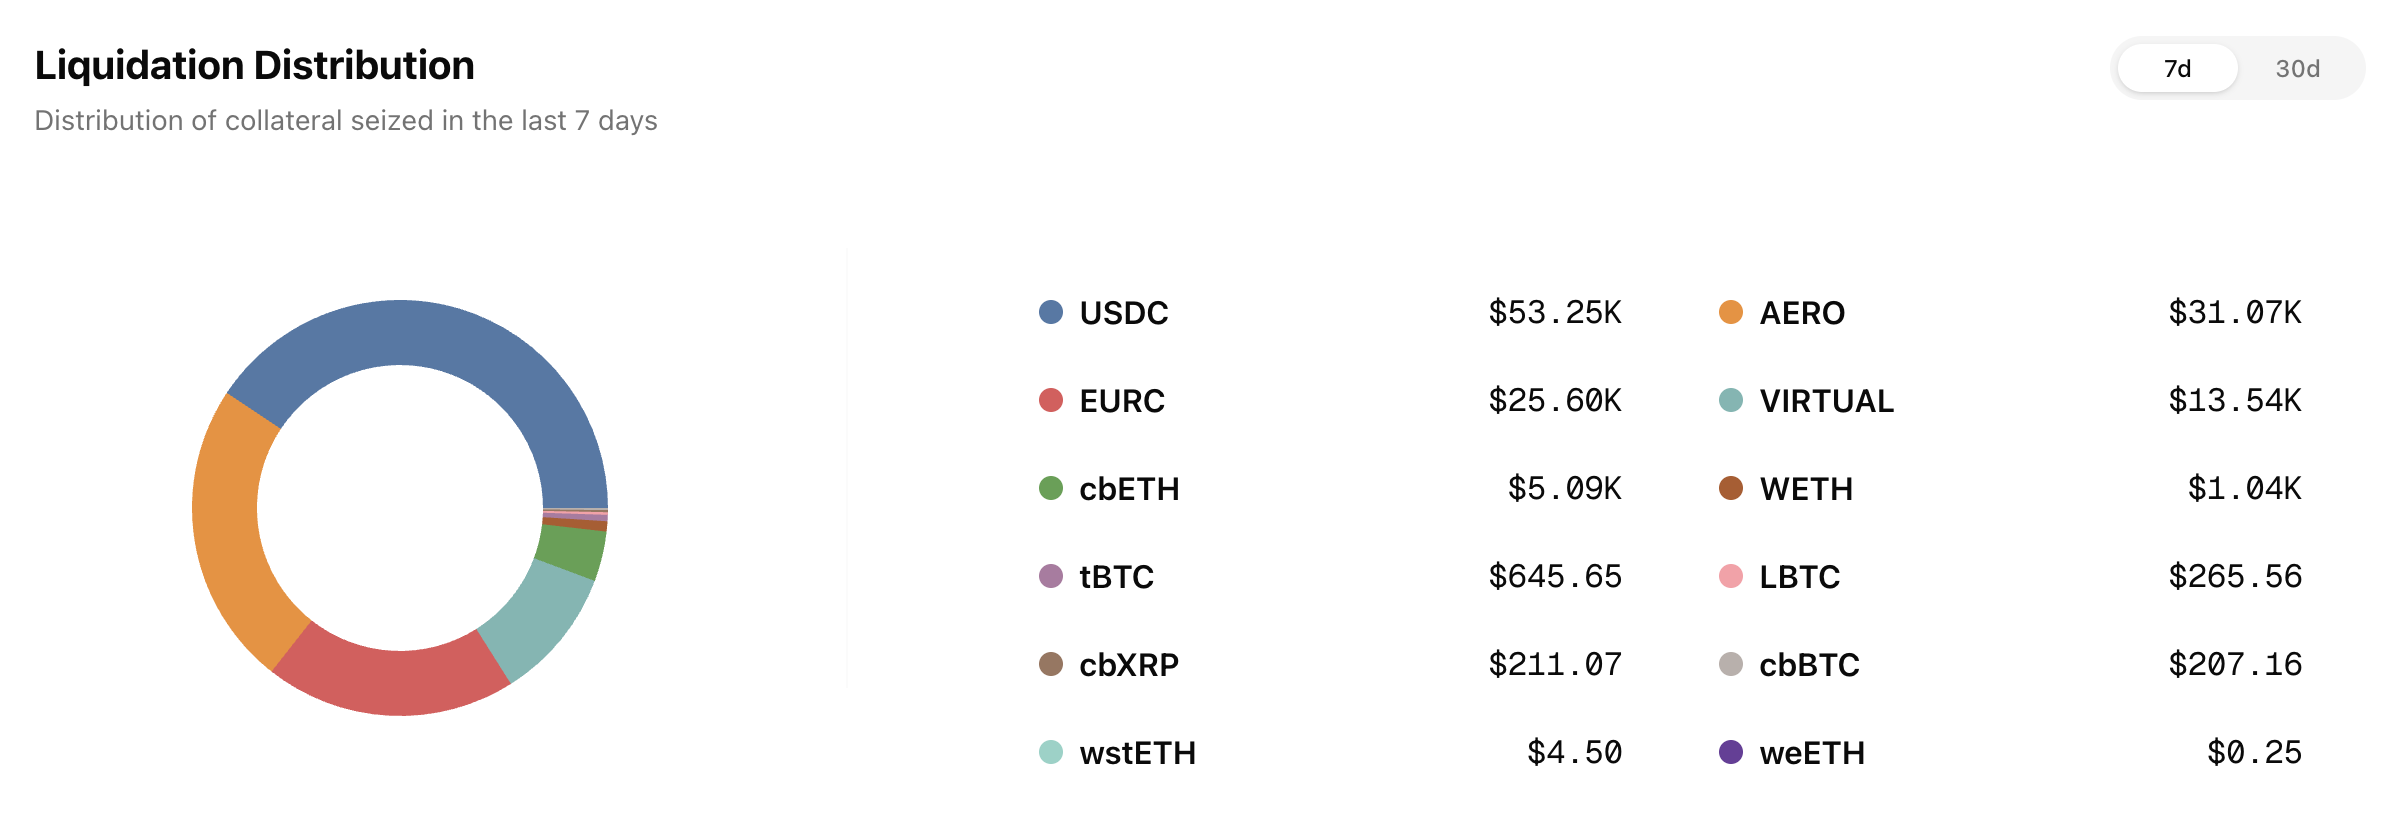
Total liquidations: 105Total Collateral Seized (USD): $129,994.06
Asset
Total Seized (Tokens)
Total Seized (USD)
Liquidation Count
USDC
52,321.254381
$52,315.14
46
AERO
34,774.850200
$31,071.68
12
EURC
21,983.782700
$25,600.00
11
VIRTUAL
7,631.545000
$13,540.36
8
cbETH
1.559843
$5,094.95
2
WETH
0.348942
$1,037.75
12
tBTC
55,242,400.000000
$645.65
2
LBTC
0.002234
$265.56
1
cbXRP
76.268000
$211.07
1
cbBTC
0.001766
$207.16
8
wstETH
0.001105
$4.50
1
weETH
0.000077
$0.25
1
Asset
Current Borrow Cap
Current Supply Cap
Average Borrow Cap Usage (Past Week)
Average Supply Cap Usage (Past Week)
Average Utilization
WETH
30.00K
32.00K
34.20%
36.42%
88.16%
USDC
34.00M
36.40M
34.10%
36.16%
88.13%
USDT0
8.00M
10.00M
23.46%
21.77%
86.39%
USDT
18.40M
22.60M
2.09%
1.98%
84.79%
DAI
4.50M
4.80M
6.49%
7.17%
84.35%
wrsETH
160.00
400.00
2.66%
9.13%
11.66%
rETH
340.00
750.00
3.55%
19.47%
8.44%
VELO
20.00M
68.00M
14.30%
59.24%
7.11%
OP
650.00K
5.60M
23.60%
43.87%
6.25%
wstETH
1.50K
5.00K
3.87%
21.80%
5.33%
WBTC
0.00
0.00
0.00%
0.00%
4.32%
weETH
220.00
1.20K
5.14%
99.37%
0.95%
cbETH
0.00
10.00
0.00%
9.00%
0.02%
Asset
Total Borrow
Total Supply
Utilization
WETH
-32% from 10.38K WETH to 7.11K WETH
-33% from 11.83K WETH to 7.87K WETH
+3% from 87.73% to 90.31%
USDC
-2% from 11.93M USDC to 11.69M USDC
-1% from 13.51M USDC to 13.31M USDC
-1% from 88.32% to 87.79%
USDT0
+10% from 1.78M USDT0 to 1.96M USDT0
-1% from 2.22M USDT0 to 2.19M USDT0
+11% from 80.24% to 89.30%
USDT
+49% from 255.30K USDT to 380.26K USDT +39% from 319.19K USDT to 443.41K USDT
+7% from 79.99% to 85.76%
DAI
+98% from 255.59K DAI to 507.32K DAI +80% from 309.78K DAI to 556.09K DAI +11% from 82.51% to 91.23%
wrsETH
+0% from 4.26 wrsETH to 4.26 wrsETH
+7% from 36.26 wrsETH to 38.72 wrsETH
-6% from 11.74% to 11.00%
rETH
+44% from 11.49 rETH to 16.54 rETH -36% from 150.92 rETH to 95.84 rETH
+127% from 7.62% to 17.26%
VELO
-24% from 3.23M VELO to 2.45M VELO
+3% from 39.96M VELO to 41.35M VELO
-27% from 8.08% to 5.93%
OP
-25% from 169.49K OP to 127.45K OP
+2% from 2.46M OP to 2.51M OP
-26% from 6.89% to 5.08%
wstETH
+19% from 57.04 wstETH to 67.87 wstETH
+1% from 1.05K wstETH to 1.06K wstETH
+18% from 5.41% to 6.38%
WBTC
0% from 0.00 WBTC to 0.00 WBTC
0% from 0.07 WBTC to 0.07 WBTC
+0% from 4.32% to 4.32%
weETH
+76% from 9.79 weETH to 17.20 weETH +1% from 1.19K weETH to 1.20K weETH
+74% from 0.82% to 1.43%
cbETH
0% from 0.00 cbETH to 0.00 cbETH
0% from 0.90 cbETH to 0.90 cbETH
0% from 0.02% to 0.02%
49% increase in USDT borrows from 255.30K to 380.26K USDT
39% increase in USDT supply from 319.19K to 443.41K USDT
98% increase in DAI borrows from 255.59K to 507.32K DAI
80% increase in DAI supply from 309.78K to 556.09K DAI
32% decrease in WETH borrows from 10.38K to 7.11K WETH
33% decrease in WETH supply from 11.83K to 7.87K WETH
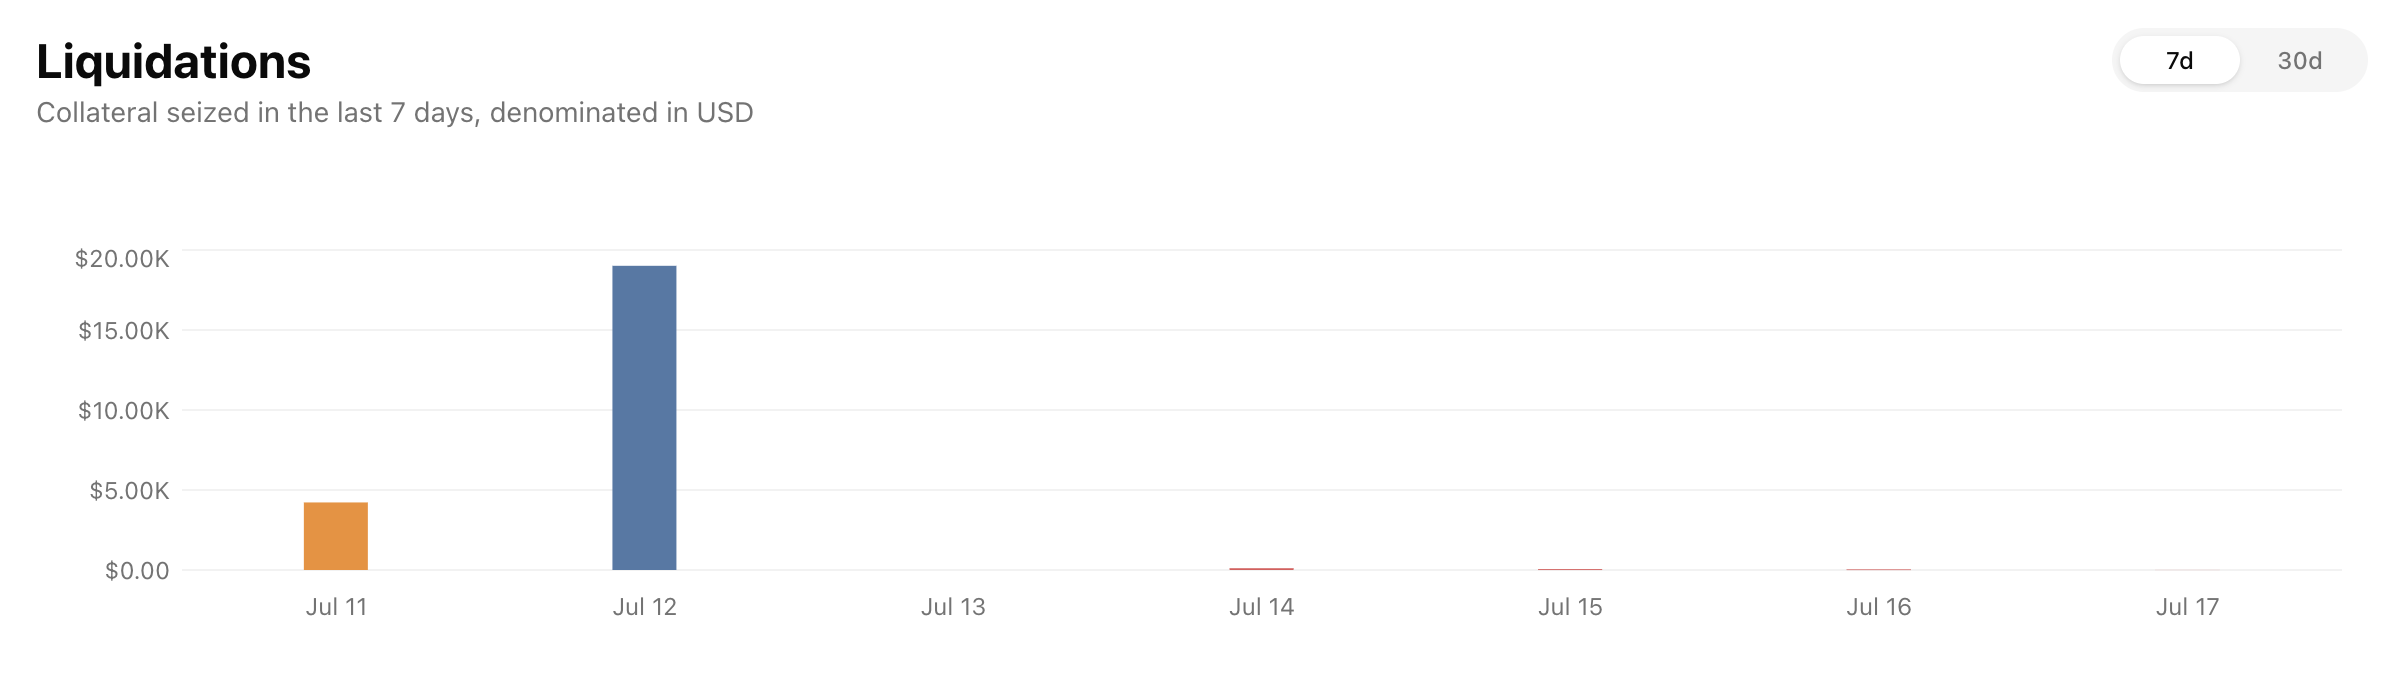
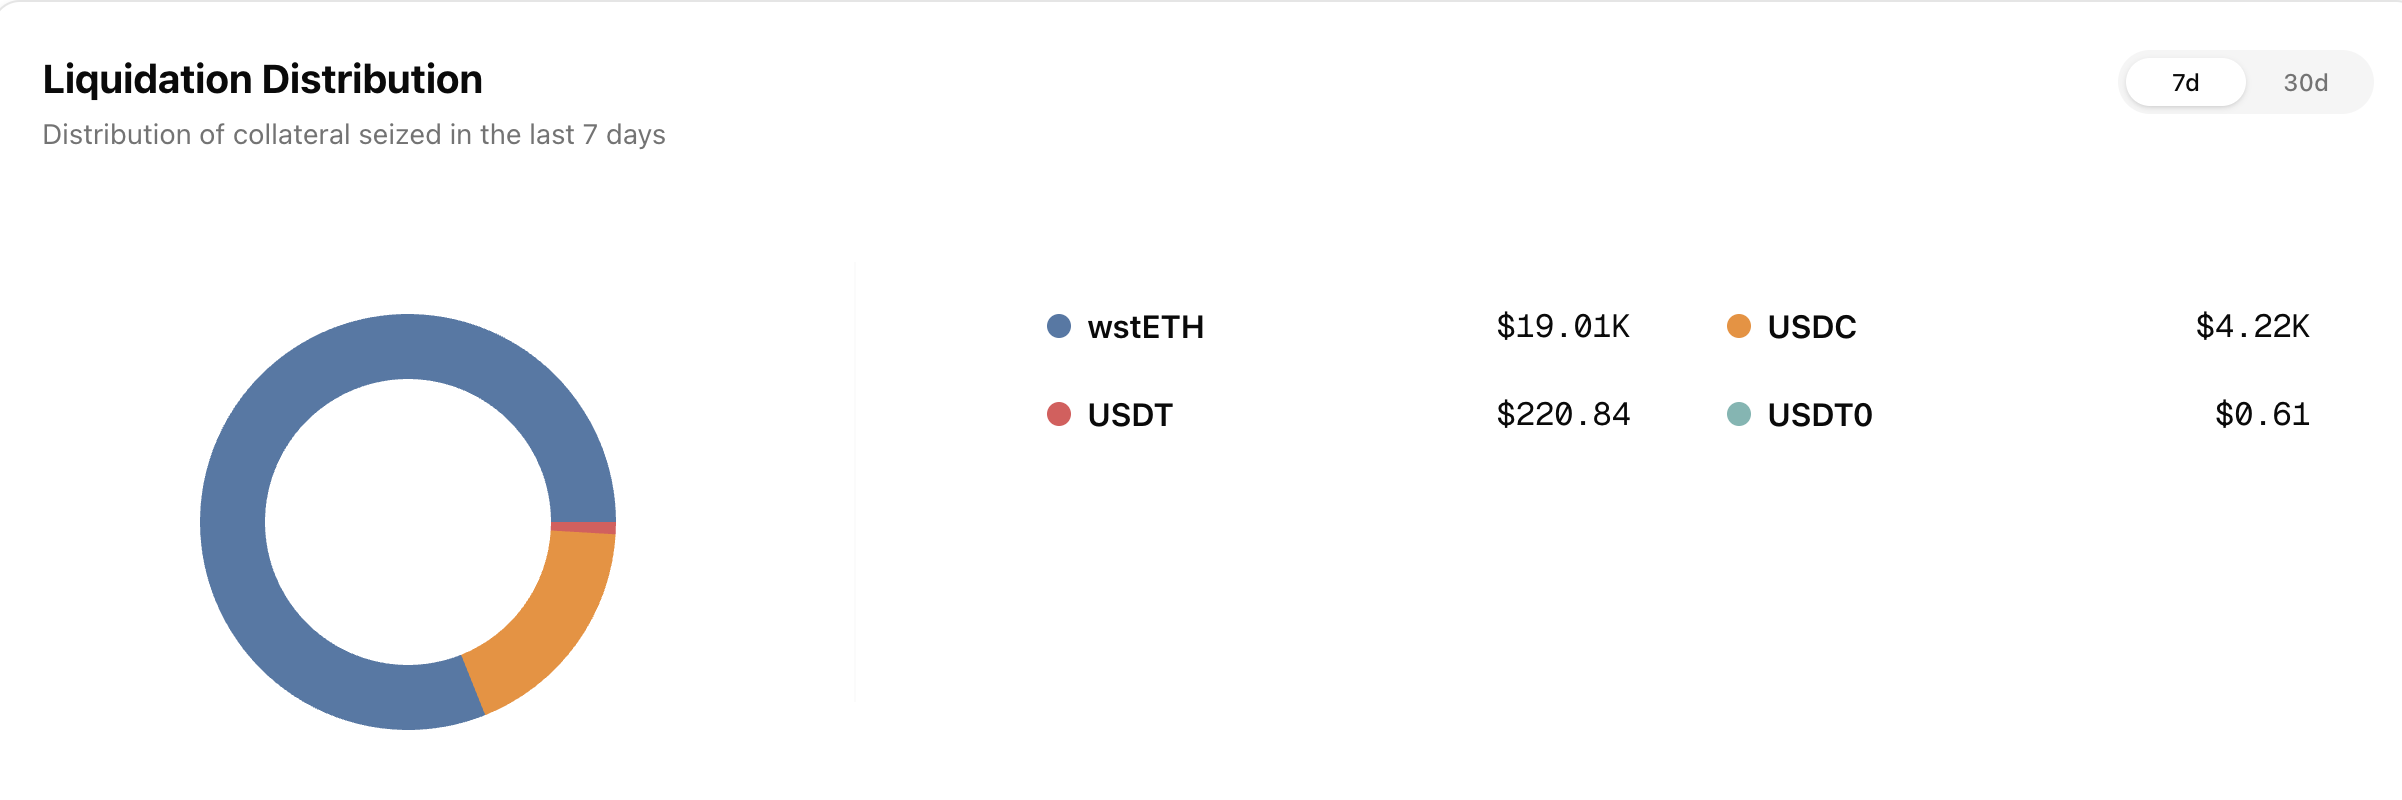
Total liquidations: 9Total Collateral Seized (USD): $23,455.97
Asset
Total Seized (Tokens)
Total Seized (USD)
Liquidation Count
wstETH
5.325800
$19,012.40
1
USDC
4,222.530000
$4,222.12
1
USDT
220.8137
$220.84
5
USDT0
0.6051
$0.61
2
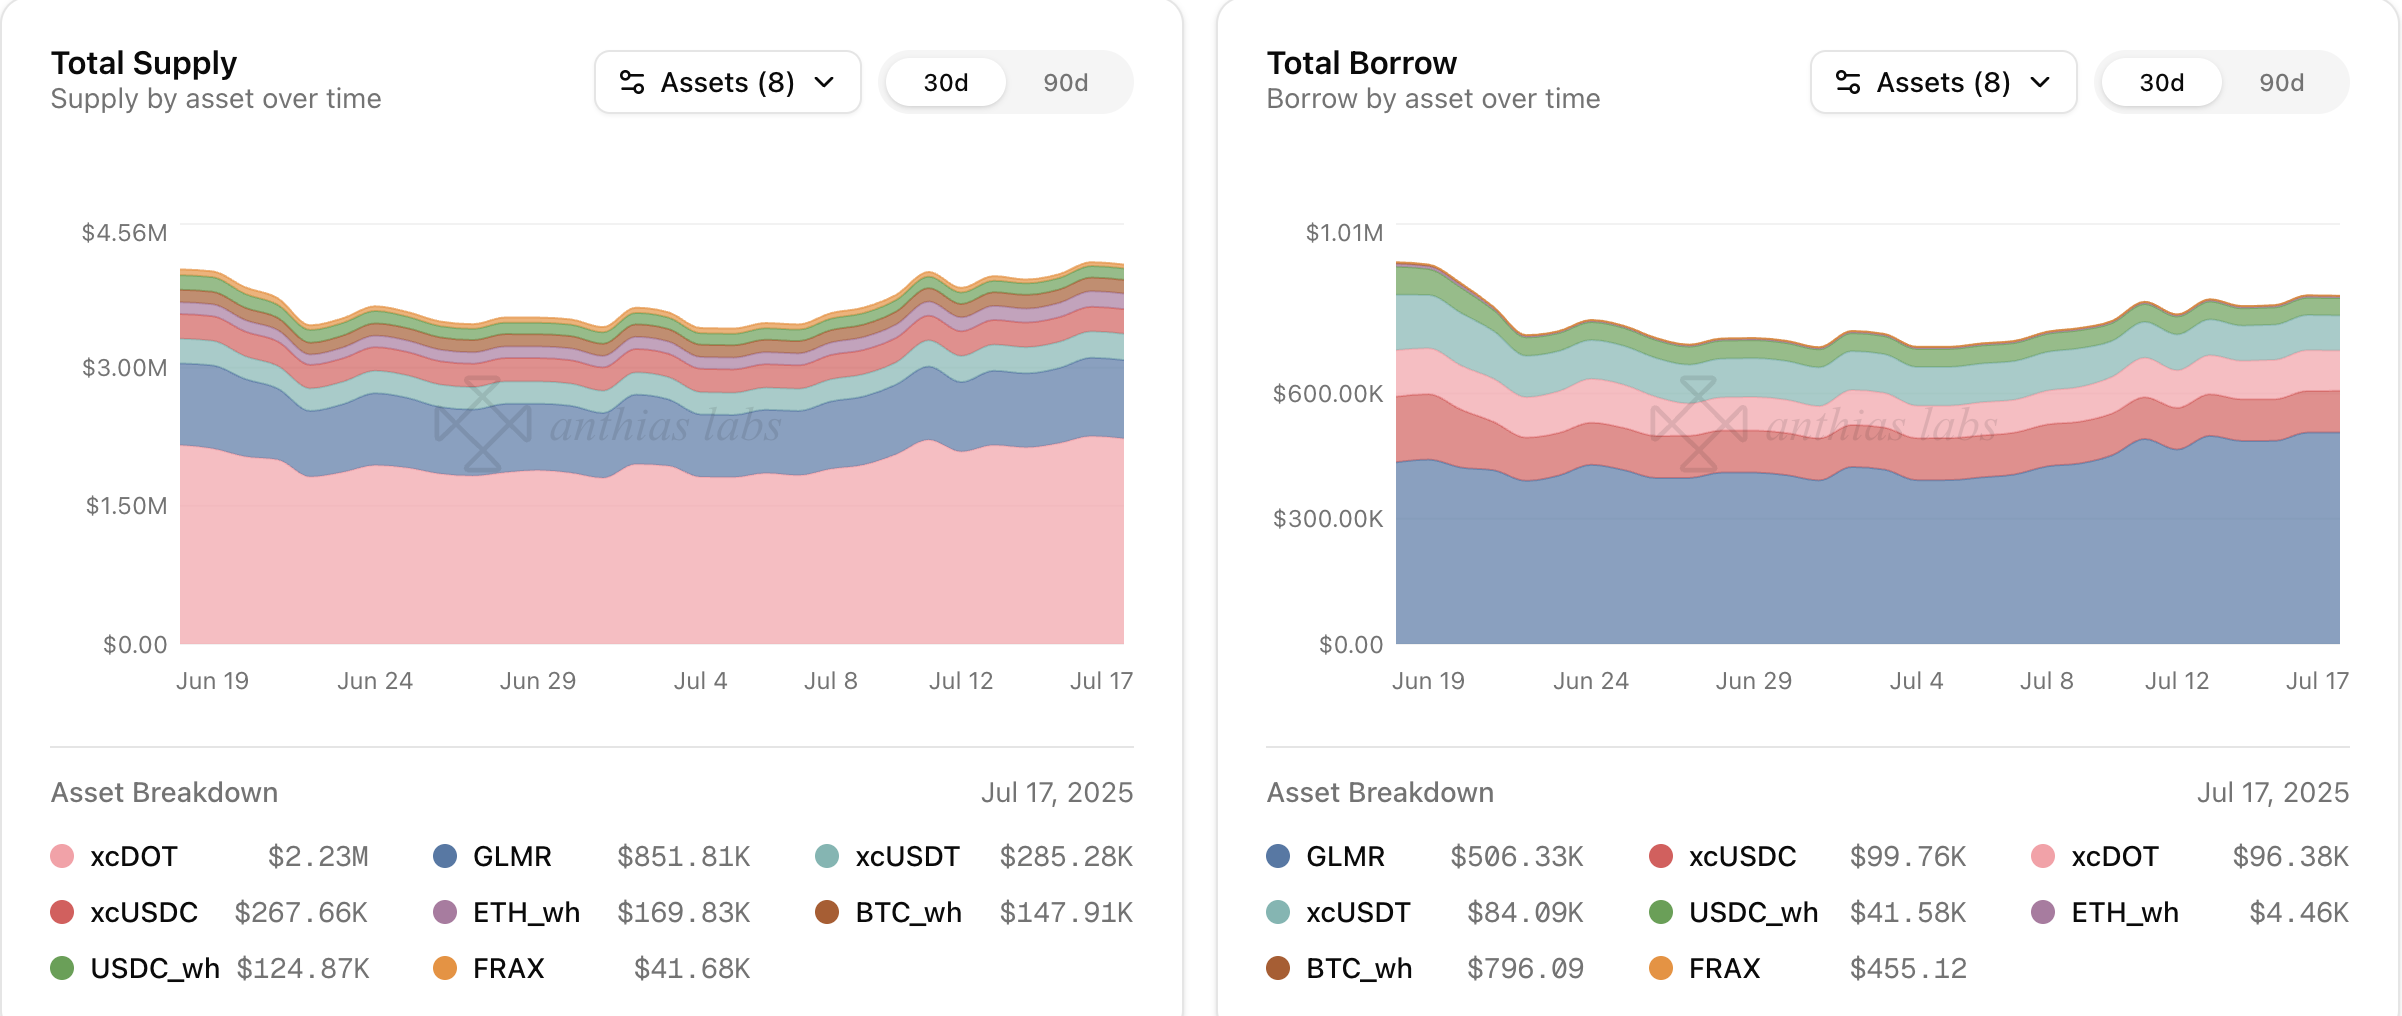
Asset
Current Borrow Cap
Average Borrow Cap Usage (Past Week)
Average Utilization
GLMR
0.10
6475.90M%
60.48%
xcUSDC
0.10
99.80M%
37.31%
USDC_wh
0.10
42.34M%
33.95%
xcUSDT
0.10
84.89M%
30.14%
xcDOT
0.10
23.21M%
4.30%
ETH_wh
0.10
1.37K%
2.68%
FRAX
0.10
455.12K%
0.99%
BTC_wh
0.10
6.70%
0.54%
Asset
Total Borrow
Total Supply
Utilization
GLMR
+1% from 6.45M GLMR to 6.49M GLMR
+2% from 10.83M GLMR to 11.00M GLMR
-1% from 59.59% to 59.03%
xcUSDC
-0% from 100.18K xcUSDC to 99.77K xcUSDC
+1% from 265.47K xcUSDC to 267.67K xcUSDC
-1% from 37.74% to 37.27%
USDC_wh
-3% from 42.98K USDC_wh to 41.58K USDC_wh
+0% from 124.59K USDC_wh to 124.87K USDC_wh
-3% from 34.50% to 33.30%
xcUSDT
-2% from 85.81K xcUSDT to 83.91K xcUSDT
+18% from 241.17K xcUSDT to 285.29K xcUSDT
-17% from 35.58% to 29.41%
xcDOT
-1% from 23.37K xcDOT to 23.18K xcDOT
-2% from 548.57K xcDOT to 536.61K xcDOT
+1% from 4.26% to 4.32%
ETH_wh
-4% from 1.37 ETH_wh to 1.32 ETH_wh
-2% from 51.30 ETH_wh to 50.46 ETH_wh
-2% from 2.68% to 2.62%
FRAX
+0% from 455.12 FRAX to 455.12 FRAX
-26% from 56.42K FRAX to 41.68K FRAX
+35% from 0.81% to 1.09%
BTC_wh
0% from 0.01 BTC_wh to 0.01 BTC_wh
0% from 1.24 BTC_wh to 1.24 BTC_wh
-0% from 0.54% to 0.54%
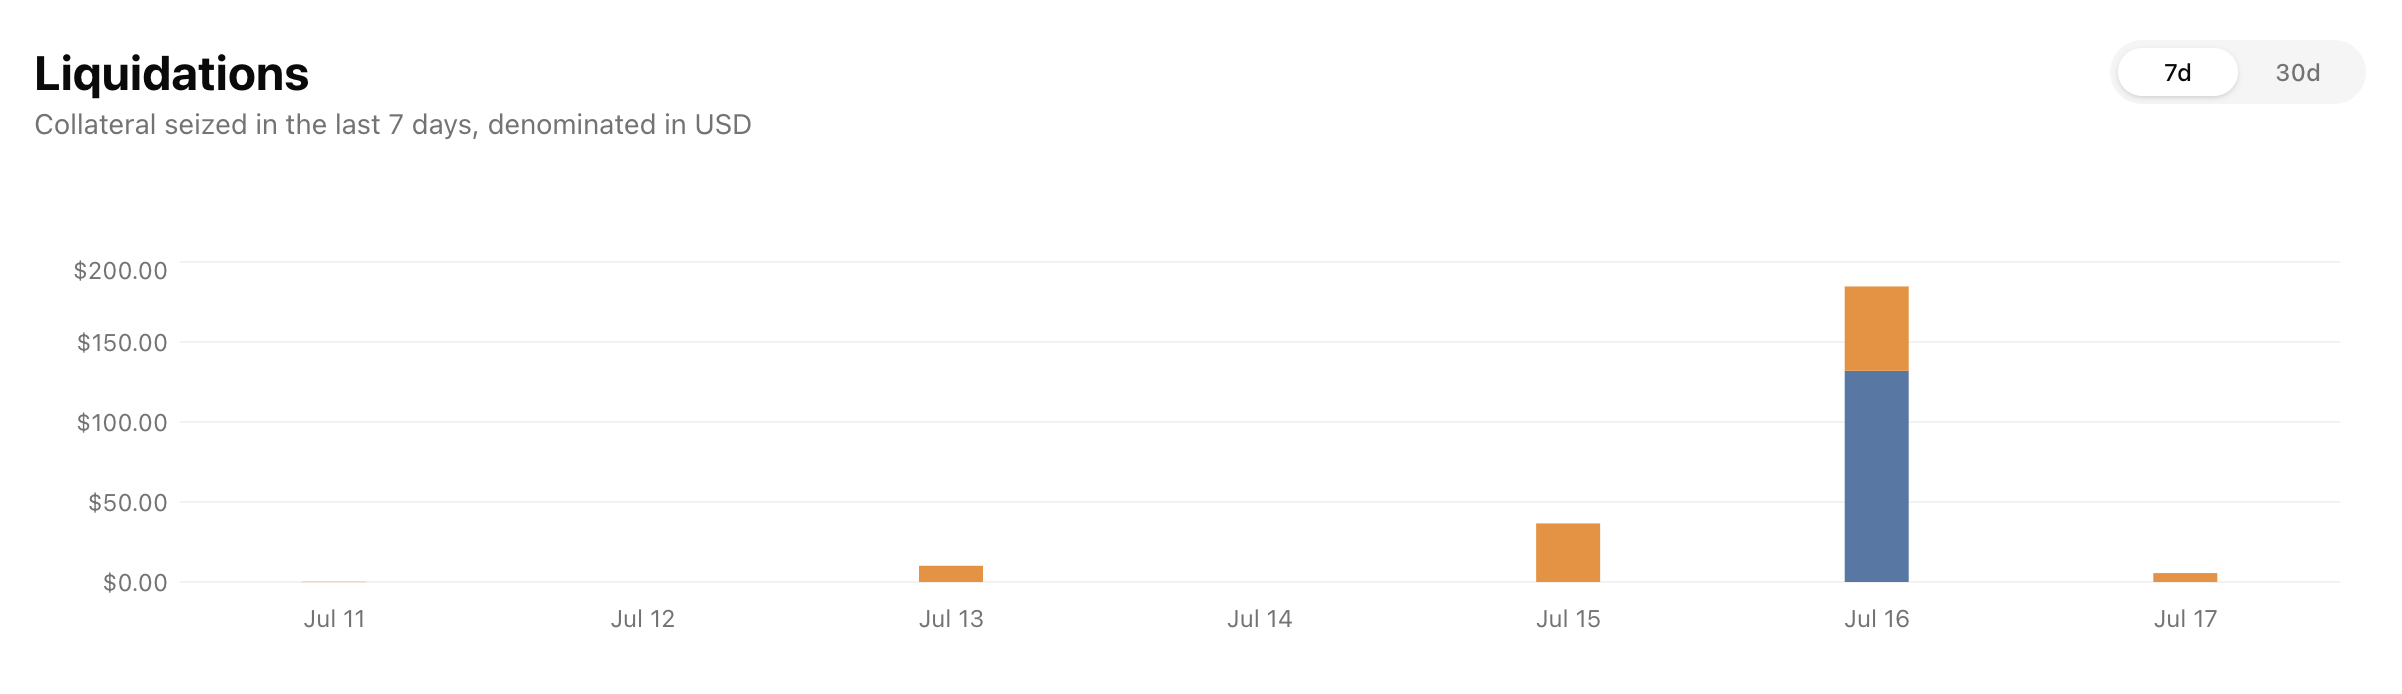
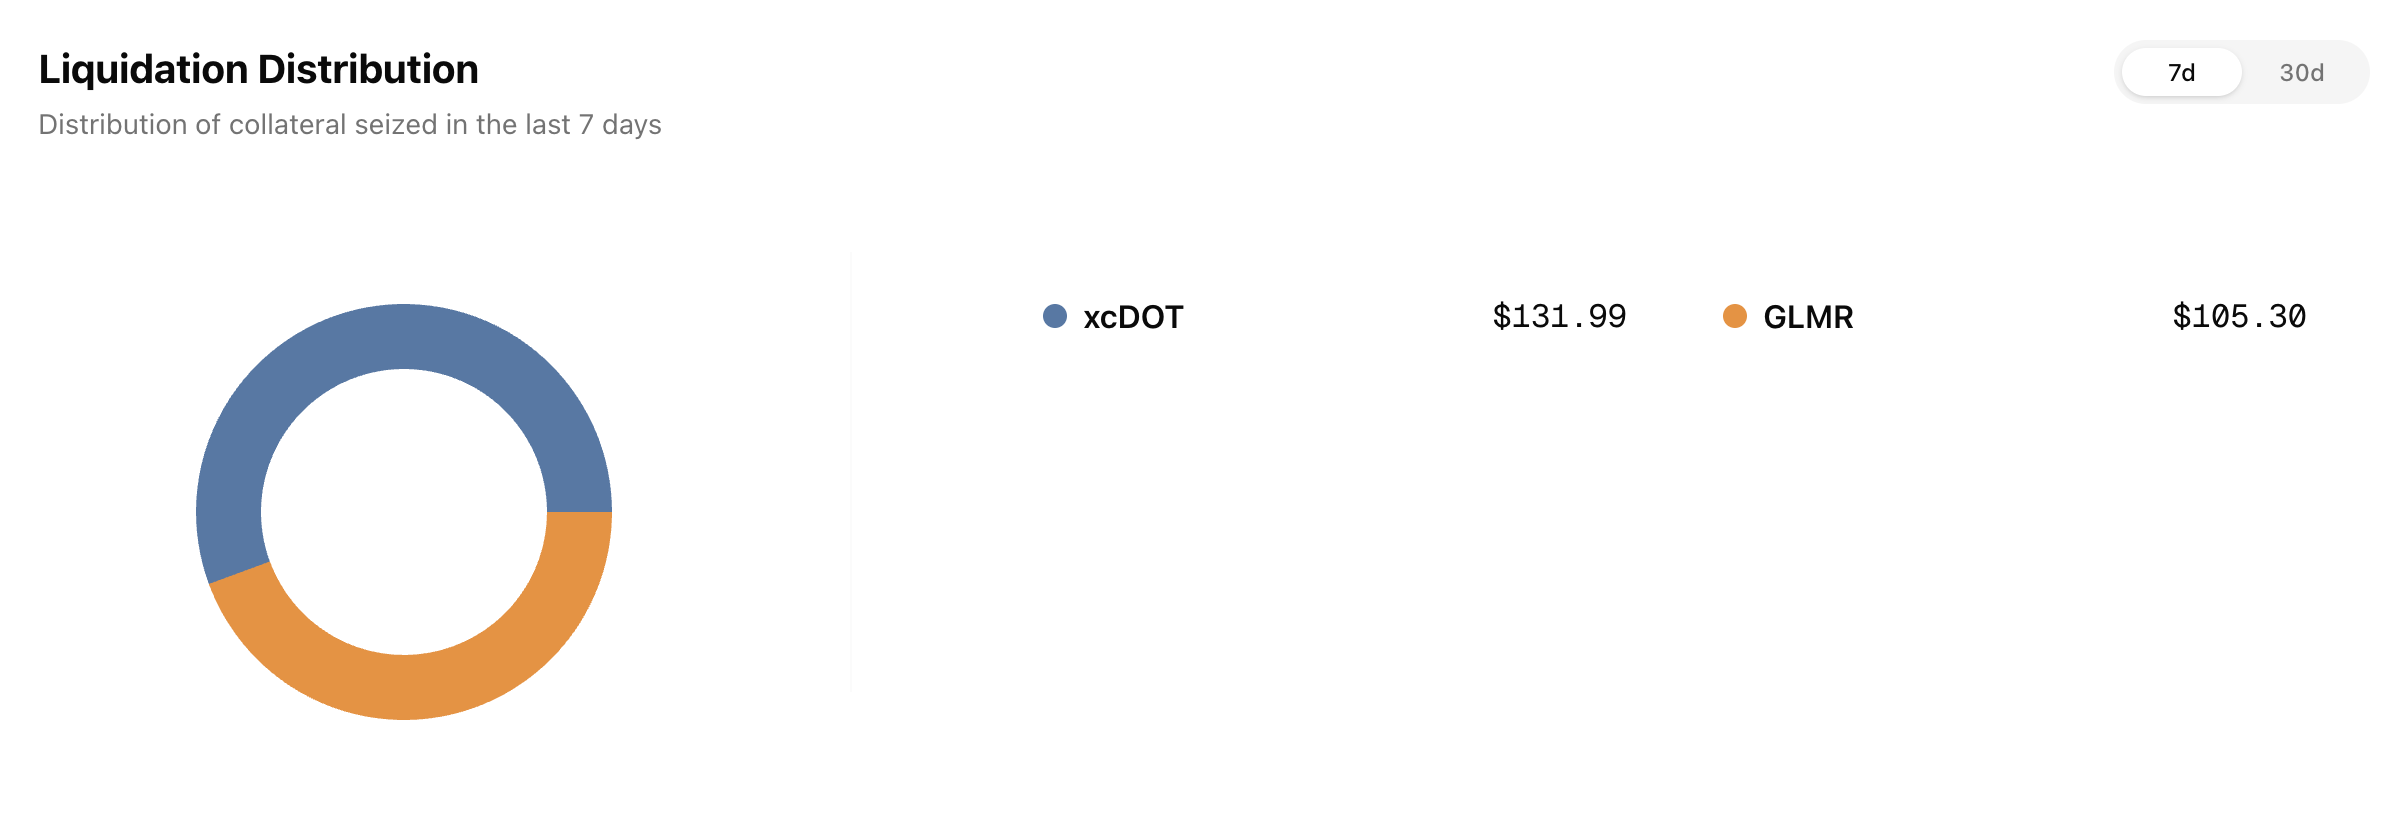
Total liquidations: 9Total Collateral Seized (USD): $237.29
Asset
Total Seized (Tokens)
Total Seized (USD)
Liquidation Count
xcDOT
31.502100
$131.99
1
GLMR
1,377.943960
$105.30
8
Asset
Current Borrow Cap
Average Borrow Cap Usage (Past Week)
Average Utilization
xcKSM
0.10
6.78M%
41.29%
FRAX
0.10
67.47M%
20.98%
MOVR
0.10
3.80M%
2.52%
Asset
Total Borrow
Total Supply
Utilization
xcKSM
+0% from 6.78K xcKSM to 6.78K xcKSM
-13% from 18.44K xcKSM to 15.96K xcKSM
+16% from 36.76% to 42.50%
FRAX
-17% from 77.03K FRAX to 64.30K FRAX
+0% from 321.42K FRAX to 321.69K FRAX
-17% from 23.96% to 19.99%
MOVR
+0% from 3.80K MOVR to 3.80K MOVR
+0% from 150.48K MOVR to 151.09K MOVR
-0% from 2.53% to 2.52%
No liquidations on Moonriver this week.
3 Likes
To Whom It May Concern,
I’m unable to withdraw my 57k xcDOT on Moonbeam, even though utilization is only 4.32%, and I haven’t borrowed anything
the latest market report shows that over 536k xcDOT is supplied and only ~23k is borrowed - so there should be plenty of liquidity
I also didn’t enable my DOT to be used as collateral. can you clarify why my DOT is locked and not withdrawable?
screenshot and wallet address can be provided if needed
I’d appreciate your support in helping me understand or resolve this issue as soon as possible.
Thanks in advance!
4 Likes
Hey @nakadot , it appears our backend indexing service, which reads on-chain data directly, is correctly indexing these numbers. However, as Moonwell contributors have informed us, there are outstanding bad-debt positions from the Nomad exploit in 2022 which count separately to available liquidity. More specifically our metrics show total supply and total borrows where total supply is the sum of supply plus reserves, and total borrows is simply the amount borrowed. Available liquidity works a bit differently, however, as it factors in bad debt. The main reason for the confusion seems to be that there are two different utilization metrics, of which our weekly report only focuses on one.
Market utilization: borrows / (supplied + reserves)
Liquidity utilization: (borrows + bad debt) / (supplied + reserves)
Below are the full metrics for the xcDOT market on Moonbeam, which hopefully clears things up.
supplied: 491,171.84 xcDOTreserves: 45,418.81 xcDOTborrowed: 23,182.19 xcDOTbad debt: 513,407.02 xcDOTliquidity: (supplied + reserves) - (borrows + badDebt)liquidity: (536,590.65 xcDOT) - (536,589.21 xcDOT)liquidity: 1.44 xcDOT
You can find more information about the bad-debt situation in this forum post , and read the above values directly from the contract here .
4 Likes
Let me be very clear:
If the protocol continues to lock new user deposits to cover legacy bad debt, without any compensation, notice, or user-level risk isolation, this is a violation of user trust and could be considered misrepresentation of available liquidity.
Therefore, I kindly request:
A clear timeline or plan for how and when the liquidity issue will be resolved.
Consideration of user refunds, compensation, or other recovery options for affected depositors.
Immediate implementation of better transparency on real withdrawable liquidity (i.e., excluding bad debt).
I hope to resolve this professionally and without escalation, but I reserve the right to take further steps if this matter remains unaddressed.
Thank you for your time and attention. I look forward to your response.
10 Likes
Anthias Labs would like to provide an update on market performance over the past week for Core markets on Base, Optimism, Moonbeam, and Moonriver. Data from 7/18/25 to 7/24/25. More information can be found on our monitoring dashboard .
Asset
Current Borrow Cap
Current Supply Cap
Average Borrow Cap Usage (Past Week)
Average Supply Cap Usage (Past Week)
Average Utilization
USDC
184.00M
200.00M
43.98%
45.03%
89.85%
WETH
64.00K
96.00K
34.29%
27.31%
83.76%
USDS
690.00K
750.00K
1.46%
1.91%
75.76%
EURC
21.00M
21.90M
19.57%
25.71%
73.13%
DAI
300.00K
400.00K
6.27%
7.84%
59.96%
AERO
25.00M
70.00M
42.76%
35.52%
43.03%
tBTC
36.00
90.00
10.54%
13.60%
31.00%
LBTC
38.00
95.00
36.91%
52.39%
28.17%
cbXRP
500.00K
1.00M
29.71%
65.43%
22.97%
WELL
75.00M
150.00M
38.37%
100.45%
19.10%
cbBTC
640.00
1.50K
21.87%
49.04%
19.01%
VIRTUAL
2.30M
4.50M
16.06%
44.69%
18.49%
USDbC
1.00
1.00
151.93K%
1.06M%
14.37%
MORPHO
1.00M
4.00M
50.94%
100.00%
12.73%
weETH
700.00
4.00K
4.42%
23.97%
3.42%
cbETH
6.40K
16.00K
1.02%
17.26%
2.36%
wstETH
4.80K
14.40K
1.88%
39.19%
1.60%
rETH
900.00
2.60K
1.74%
50.02%
1.21%
wrsETH
430.00
1.00K
0.24%
15.27%
0.69%
Asset
Total Borrow
Total Supply
Utilization
USDC
-4% from 78.44M USDC to 75.55M USDC
-4% from 87.14M USDC to 83.71M USDC
+0% from 90.01% to 90.25%
WETH
+24% from 21.57K WETH to 26.71K WETH
+12% from 26.78K WETH to 29.97K WETH
+11% from 80.57% to 89.13%
USDS
+43% from 9.40K USDS to 13.42K USDS +61% from 11.29K USDS to 18.19K USDS -11% from 83.32% to 73.78%
EURC
+7% from 4.03M EURC to 4.30M EURC
-5% from 5.71M EURC to 5.41M EURC
+13% from 70.68% to 79.60%
DAI
+15% from 17.40K DAI to 19.94K DAI
-0% from 31.43K DAI to 31.36K DAI
+15% from 55.35% to 63.60%
AERO
-7% from 11.15M AERO to 10.37M AERO
+8% from 24.42M AERO to 26.41M AERO
-14% from 45.64% to 39.26%
tBTC
+30% from 3.05 tBTC to 3.96 tBTC
-6% from 12.50 tBTC to 11.72 tBTC
+39% from 24.39% to 33.78%
LBTC
-4% from 14.45 LBTC to 13.93 LBTC
+2% from 49.86 LBTC to 50.79 LBTC
-5% from 28.98% to 27.42%
cbXRP
-13% from 154.72K cbXRP to 134.81K cbXRP
+39% from 578.29K cbXRP to 803.53K cbXRP
-37% from 26.76% to 16.78%
WELL
-6% from 28.50M WELL to 26.69M WELL
+1% from 149.44M WELL to 151.25M WELL
-7% from 19.07% to 17.64%
cbBTC
-7% from 129.94 cbBTC to 120.21 cbBTC
+3% from 704.67 cbBTC to 725.01 cbBTC
-10% from 18.44% to 16.58%
VIRTUAL
-6% from 396.20K VIRTUAL to 372.99K VIRTUAL
+16% from 1.79M VIRTUAL to 2.07M VIRTUAL
-19% from 22.17% to 18.05%
USDbC
+0% from 1.52K USDbC to 1.52K USDbC
-3% from 10.64K USDbC to 10.29K USDbC
+3% from 14.27% to 14.77%
MORPHO
+3% from 508.76K MORPHO to 522.73K MORPHO
+0% from 4.00M MORPHO to 4.00M MORPHO
+3% from 12.71% to 13.06%
weETH
-4% from 31.23 weETH to 29.97 weETH
+206% from 709.40 weETH to 2.17K weETH -69% from 4.40% to 1.38%
cbETH
-1% from 65.57 cbETH to 65.16 cbETH
+3% from 2.76K cbETH to 2.84K cbETH
-3% from 2.37% to 2.30%
wstETH
-0% from 88.74 wstETH to 88.48 wstETH
+20% from 5.19K wstETH to 6.24K wstETH
-17% from 1.71% to 1.42%
rETH
-0% from 15.71 rETH to 15.67 rETH
+0% from 1.29K rETH to 1.30K rETH
-0% from 1.22% to 1.21%
wrsETH
+856% from 0.23 wrsETH to 2.21 wrsETH -1% from 153.64 wrsETH to 152.03 wrsETH
+866% from 0.15% to 1.46%
WETH borrows increased by 24% from 21.57K to 26.71K WETH
cbXRP supply increased by 39% from 578.29K to 803.53K cbXRP
weETH supply increased by 206% from 709.40 to 2.17K weETH
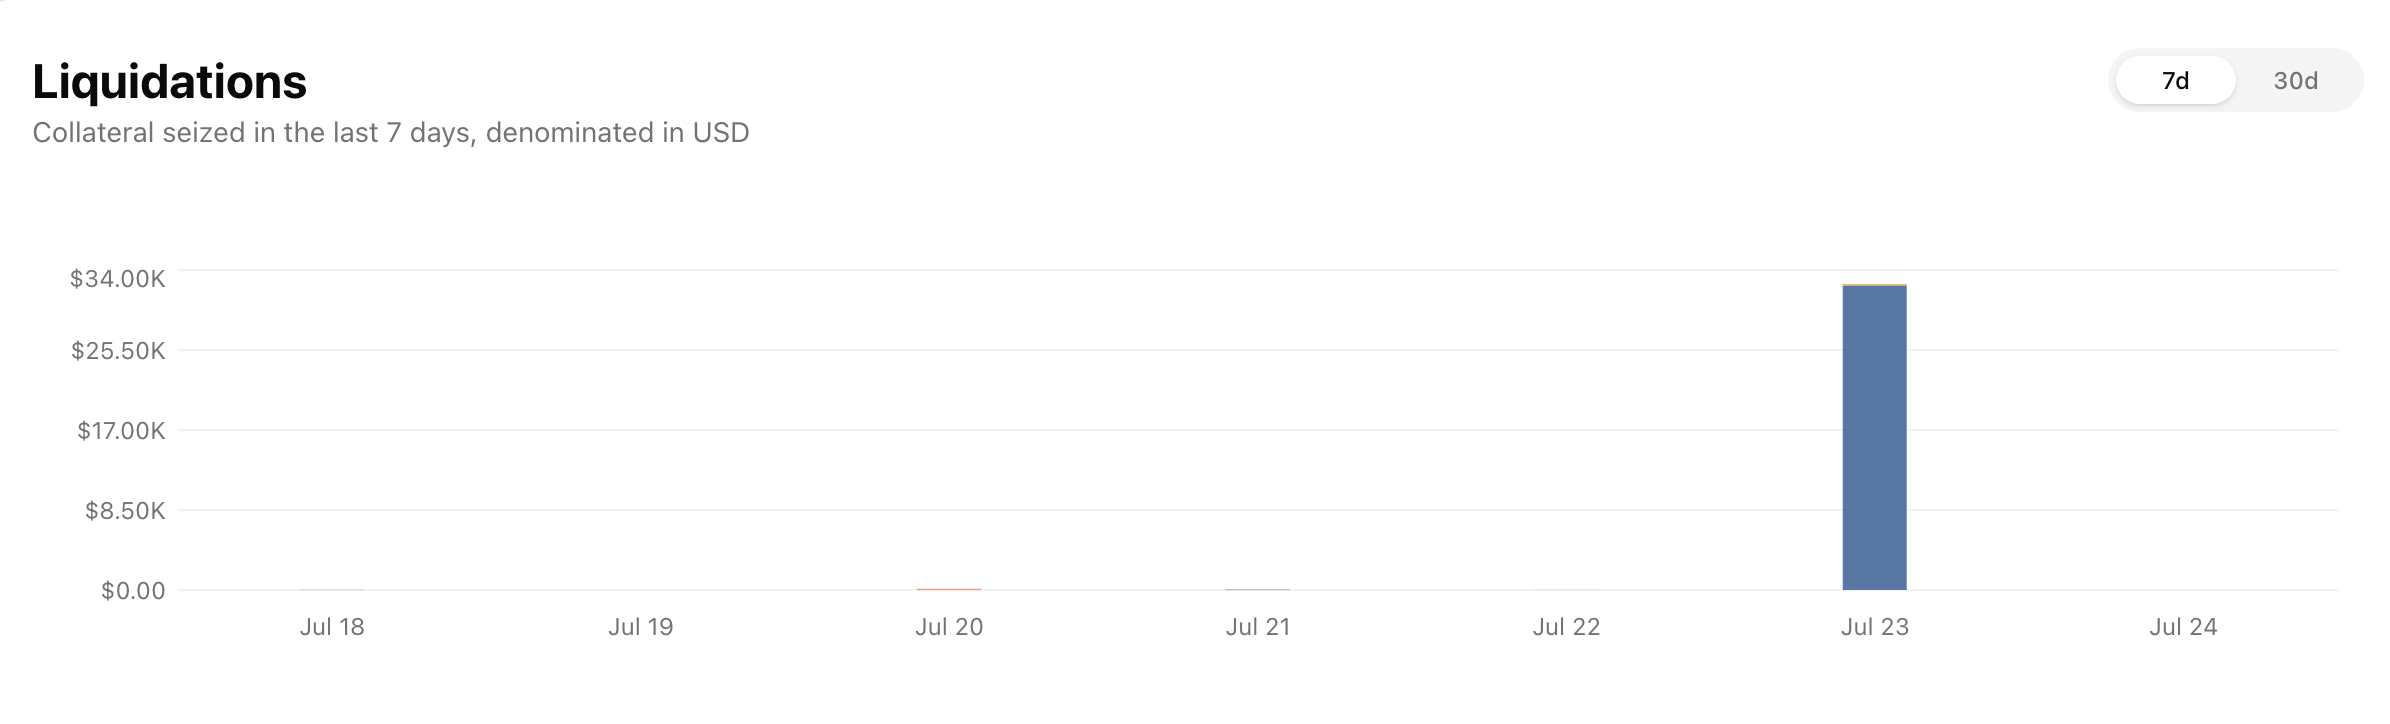
Total liquidations: 96Total Collateral Seized (USD): $202,689.34Total Debt Repaid (USD): $184,263.03Total Liquidation Bonus (USD): $18,426.30Total Liquidator Bonus (USD): $12,898.41Total Protocol Bonus (USD): $5,527.89
Asset
Total Seized (Tokens)
Total Seized (USD)
Debt Repaid (USD)
Liquidation Bonus (USD)
Liquidator Bonus (USD)
Protocol Bonus (USD)
Liquidation Count
cbXRP
25,957.019600
$87,115.94
$79,196.31
$7,919.63
$5,543.74
$2,375.89
4
USDC
79,939.384259
$79,929.07
$72,662.79
$7,266.28
$5,086.40
$2,179.88
26
AERO
19,701.629300
$17,614.12
$16,012.84
$1,601.28
$1,120.90
$480.39
11
WELL
273,298.897900
$8,498.24
$7,725.68
$772.57
$540.80
$231.77
5
cbBTC
0.023151
$2,713.39
$2,466.72
$246.67
$172.67
$74.00
10
EURC
2,279.412000
$2,667.06
$2,424.60
$242.46
$169.72
$72.74
3
VIRTUAL
1,454.376200
$2,626.95
$2,388.14
$238.81
$167.17
$71.64
10
cbETH
0.177105
$698.09
$634.62
$63.46
$44.42
$19.04
1
WETH
0.133389
$492.43
$447.67
$44.77
$31.34
$13.43
14
tBTC
0.001419
$168.49
$153.17
$15.32
$10.72
$4.60
5
LBTC
0.001034
$124.46
$113.15
$11.31
$7.92
$3.39
4
wstETH
0.007456
$32.65
$29.68
$2.97
$2.08
$0.89
1
USDS
7.702760
$7.70
$7.00
$0.70
$0.49
$0.21
1
DAI
0.745667
$0.75
$0.68
$0.07
$0.05
$0.02
1
Asset
Current Borrow Cap
Current Supply Cap
Average Borrow Cap Usage (Past Week)
Average Supply Cap Usage (Past Week)
Average Utilization
USDC
34.00M
36.40M
32.79%
34.28%
89.38%
WETH
30.00K
32.00K
28.01%
29.57%
89.05%
USDT0
8.00M
10.00M
21.41%
19.55%
87.56%
DAI
4.50M
4.80M
8.78%
9.41%
87.38%
USDT
18.40M
22.60M
1.73%
1.70%
81.88%
rETH
340.00
750.00
4.25%
12.81%
15.04%
wrsETH
160.00
400.00
2.51%
9.68%
10.38%
wstETH
1.50K
5.00K
4.67%
21.26%
6.58%
VELO
20.00M
68.00M
13.46%
62.73%
6.31%
OP
650.00K
5.60M
19.45%
45.42%
4.97%
WBTC
0.00
0.00
0.00%
0.00%
4.32%
weETH
220.00
1.20K
9.17%
99.88%
1.68%
cbETH
0.00
10.00
0.00%
9.00%
0.02%
Asset
Total Borrow
Total Supply
Utilization
USDC
+8% from 11.69M USDC to 12.65M USDC
+6% from 13.31M USDC to 14.12M USDC
+2% from 87.77% to 89.58%
WETH
+47% from 7.10K WETH to 10.42K WETH +52% from 7.85K WETH to 11.95K WETH -4% from 90.49% to 87.23%
USDT0
-8% from 1.96M USDT0 to 1.79M USDT0
-9% from 2.19M USDT0 to 2.00M USDT0
+1% from 89.26% to 89.86%
DAI
-24% from 506.72K DAI to 383.15K DAI
-21% from 556.10K DAI to 439.42K DAI
-4% from 91.12% to 87.20%
USDT
-33% from 380.27K USDT to 256.11K USDT
-26% from 442.71K USDT to 326.33K USDT
-9% from 85.90% to 78.48%
rETH
-15% from 16.54 rETH to 14.08 rETH
-1% from 95.84 rETH to 95.08 rETH
-14% from 17.26% to 14.81%
wrsETH
-8% from 4.26 wrsETH to 3.90 wrsETH
+0% from 38.72 wrsETH to 38.72 wrsETH
-8% from 11.00% to 10.08%
wstETH
+5% from 67.95 wstETH to 71.03 wstETH
+1% from 1.06K wstETH to 1.07K wstETH
+4% from 6.40% to 6.63%
VELO
+12% from 2.45M VELO to 2.75M VELO
+4% from 41.27M VELO to 42.81M VELO
+8% from 5.94% to 6.42%
OP
-2% from 127.45K OP to 124.96K OP
+2% from 2.51M OP to 2.56M OP
-4% from 5.08% to 4.88%
WBTC
0% from 0.00 WBTC to 0.00 WBTC
0% from 0.07 WBTC to 0.07 WBTC
+0% from 4.32% to 4.32%
weETH
+27% from 17.20 weETH to 21.82 weETH
+0% from 1.20K weETH to 1.20K weETH
+26% from 1.44% to 1.82%
cbETH
0% from 0.00 cbETH to 0.00 cbETH
0% from 0.90 cbETH to 0.90 cbETH
0% from 0.02% to 0.02%
WETH supply increased by 52% from 7.85K to 11.95K WETH
WETH borrows increased by 47% from 7.10K to 10.42K WETH
USDT supply decreased by 26% from 442.71K USDT to 326.33K USDT
USDT borrows decreased by 33% from 380.27K to 256.11K USDT
Total liquidations: 17Total Collateral Seized (USD): $32,742.00Total Debt Repaid (USD): $29,765.45Total Liquidation Bonus (USD): $2,976.55Total Liquidator Bonus (USD): $2,083.58Total Protocol Bonus (USD): $892.96
Asset
Total Seized (Tokens)
Total Seized (USD)
Debt Repaid (USD)
Liquidation Bonus (USD)
Liquidator Bonus (USD)
Protocol Bonus (USD)
Liquidation Count
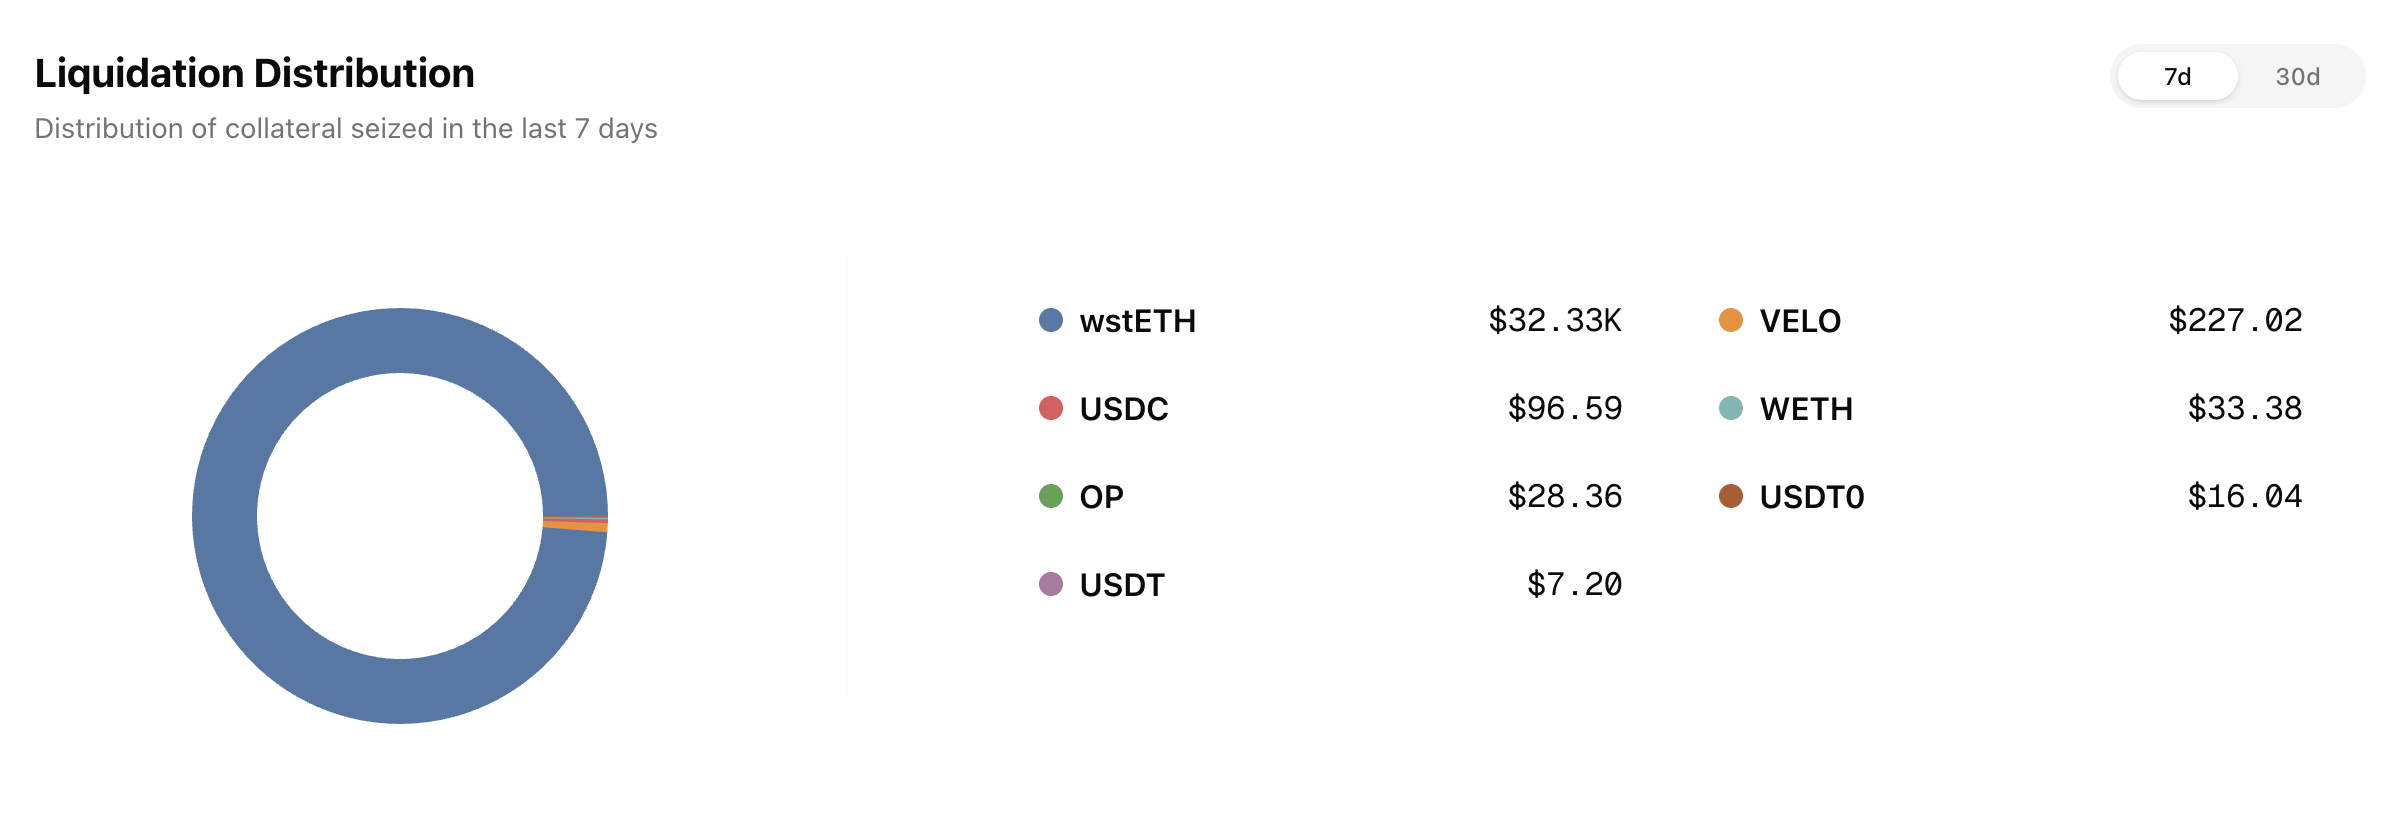
wstETH
7.582620
$32,333.40
$29,394.00
$2,939.40
$2,057.58
$881.82
1
VELO
3,866.096000
$227.02
$206.39
$20.64
$14.45
$6.19
4
USDC
96.599300
$96.59
$87.81
$8.78
$6.15
$2.63
2
WETH
0.008875
$33.38
$30.35
$3.03
$2.12
$0.91
1
OP
36.695800
$28.36
$25.78
$2.58
$1.80
$0.77
1
USDT0
16.032102
$16.04
$14.59
$1.46
$1.02
$0.44
5
USDT
7.196850
$7.20
$6.54
$0.65
$0.46
$0.20
3
Asset
Current Borrow Cap
Average Borrow Cap Usage (Past Week)
Average Utilization
GLMR
0.10
6518.47M%
62.43%
xcUSDC
0.10
98.77M%
58.02%
xcUSDT
0.10
83.95M%
44.82%
USDC_wh
0.10
41.46M%
33.19%
xcDOT
0.10
23.19M%
4.32%
ETH_wh
0.10
1.31K%
2.70%
FRAX
0.10
454.49K%
1.10%
BTC_wh
0.10
6.70%
0.54%
Asset
Total Borrow
Total Supply
Utilization
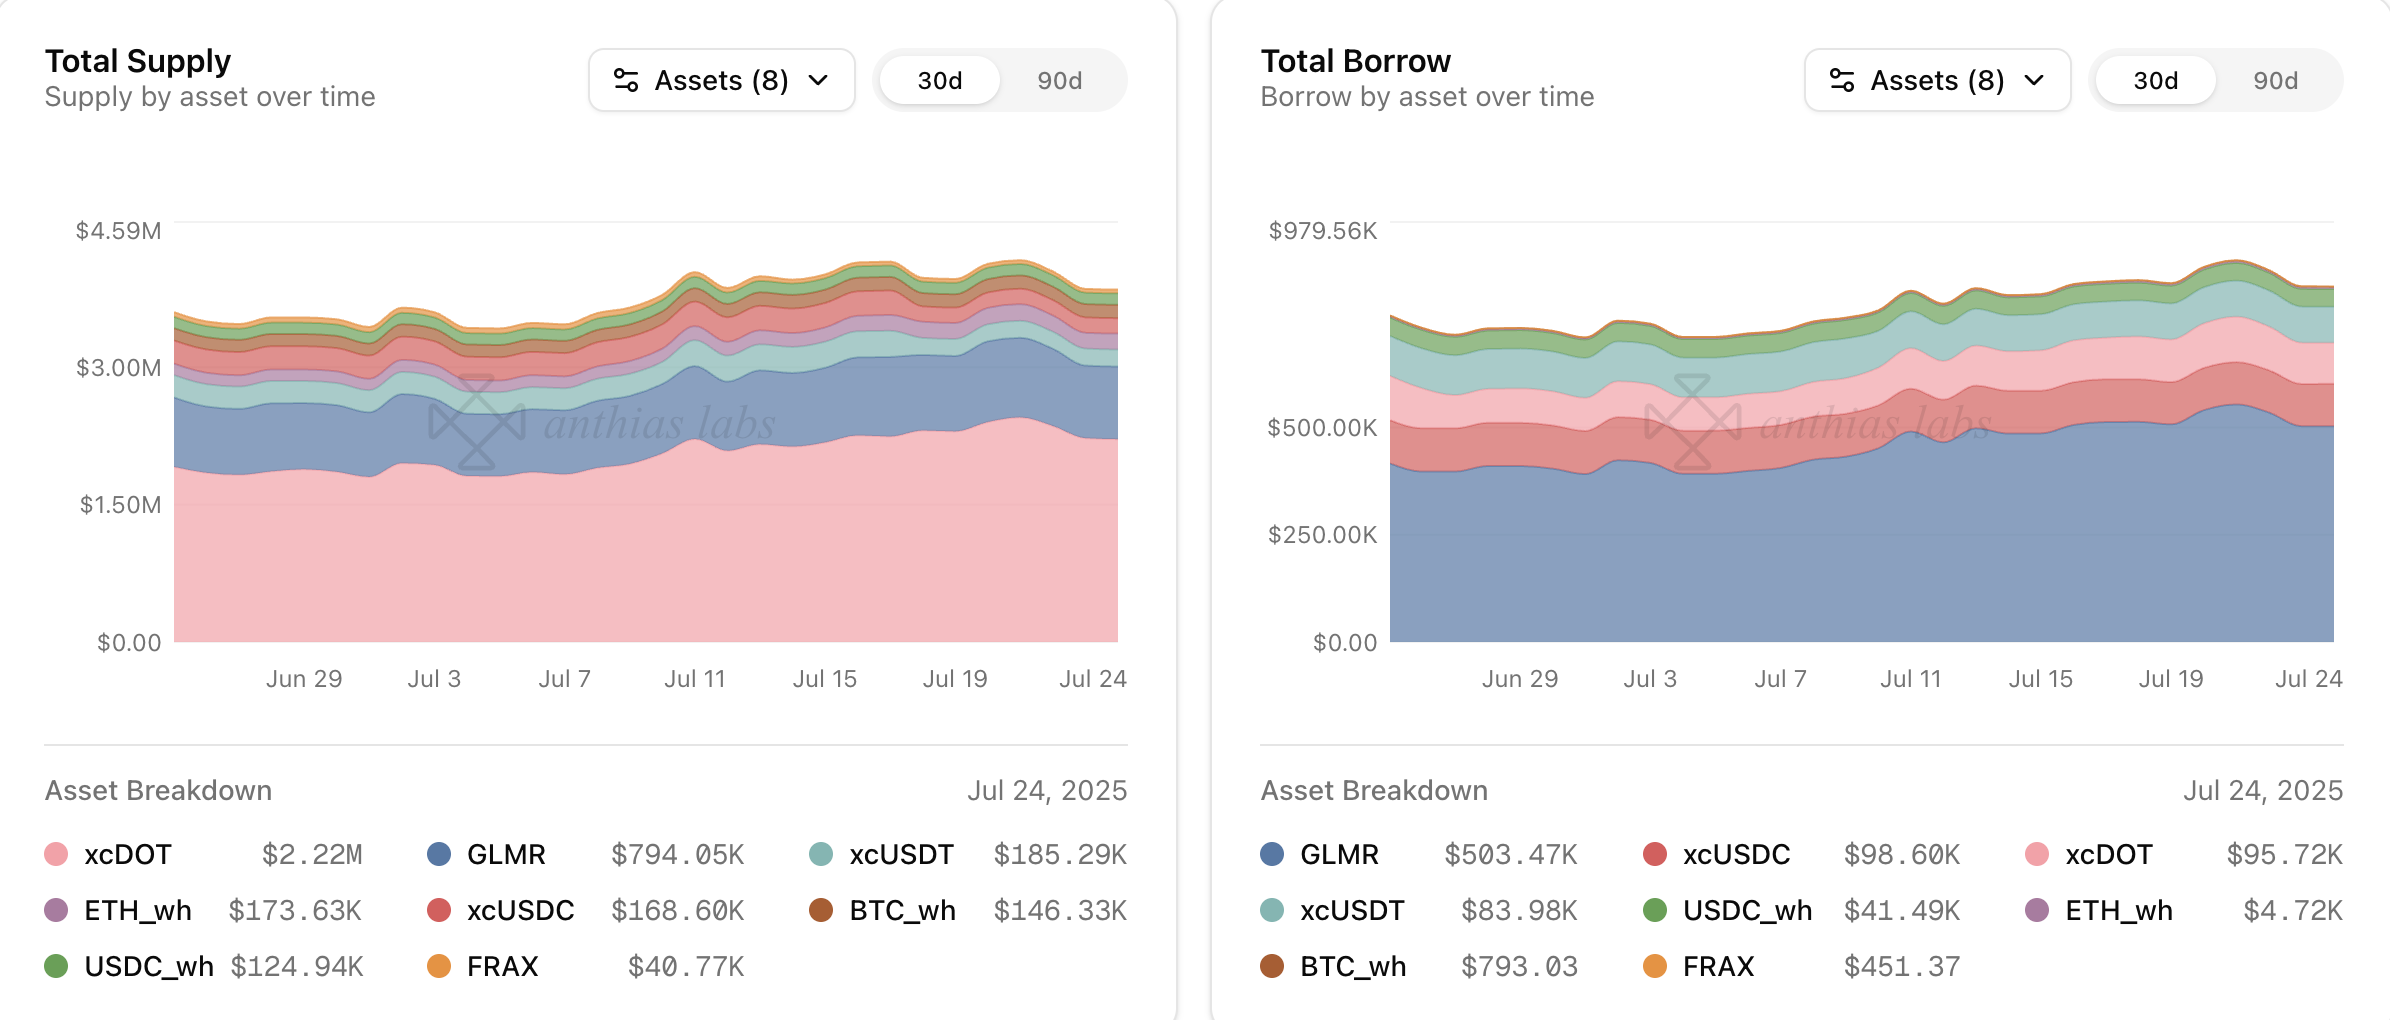
GLMR
+1% from 6.49M GLMR to 6.55M GLMR
-6% from 11.00M GLMR to 10.32M GLMR
+7% from 59.03% to 63.40%
xcUSDC
-1% from 99.77K xcUSDC to 98.60K xcUSDC
-37% from 267.67K xcUSDC to 168.60K xcUSDC
+57% from 37.27% to 58.48%
xcUSDT
+0% from 83.91K xcUSDT to 83.98K xcUSDT
-35% from 285.29K xcUSDT to 185.31K xcUSDT
+54% from 29.41% to 45.32%
USDC_wh
-0% from 41.58K USDC_wh to 41.49K USDC_wh
+0% from 124.87K USDC_wh to 124.94K USDC_wh
-0% from 33.30% to 33.21%
xcDOT
+0% from 23.18K xcDOT to 23.19K xcDOT
-0% from 536.61K xcDOT to 536.60K xcDOT
+0% from 4.32% to 4.32%
ETH_wh
-2% from 1.32 ETH_wh to 1.29 ETH_wh
-5% from 50.46 ETH_wh to 47.96 ETH_wh
+3% from 2.62% to 2.70%
FRAX
-1% from 455.12 FRAX to 451.37 FRAX
-2% from 41.68K FRAX to 40.77K FRAX
+1% from 1.09% to 1.11%
BTC_wh
0% from 0.01 BTC_wh to 0.01 BTC_wh
-1% from 1.24 BTC_wh to 1.24 BTC_wh
+1% from 0.54% to 0.54%
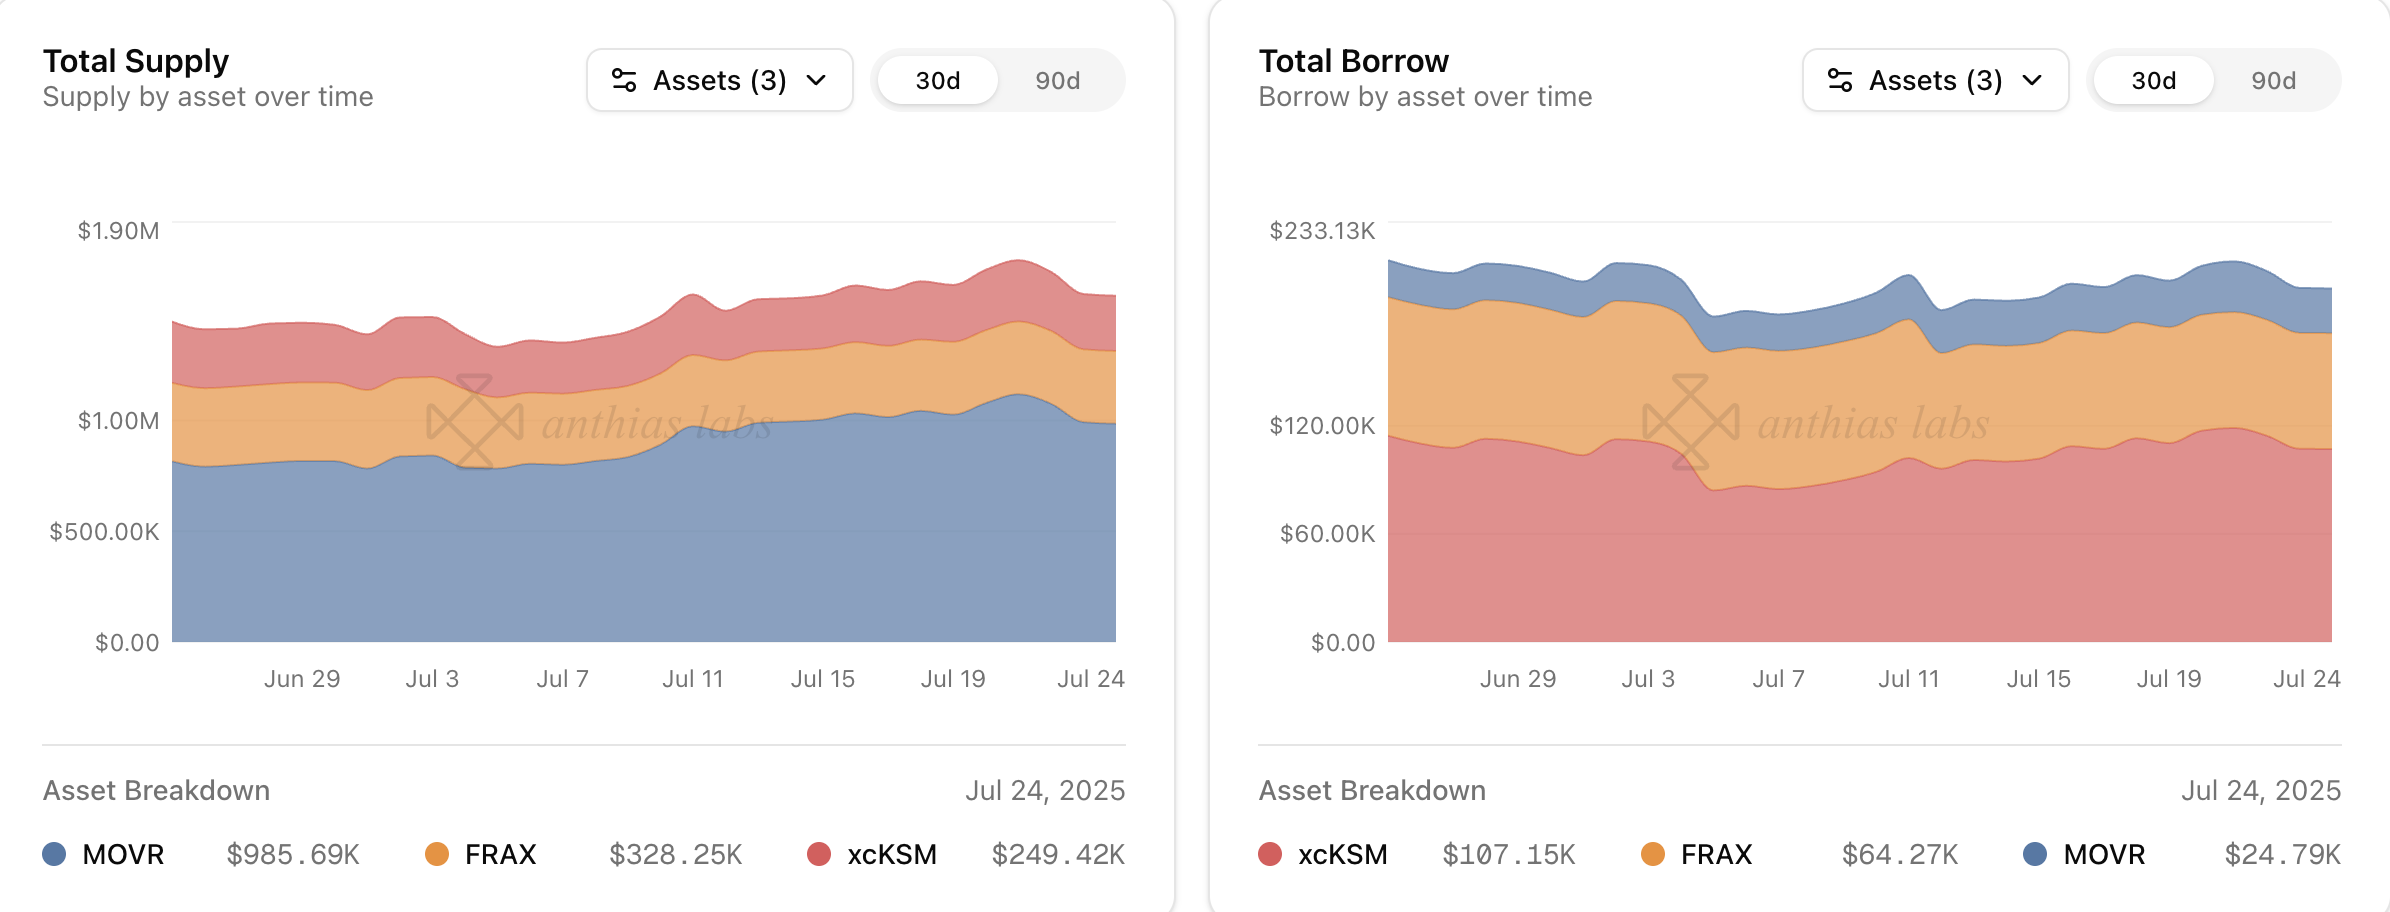
xcUSDC supply decreased by 37% from 267.67K to 168.60K xcUSDC
xcUSDT supply decreased by 35% from 285.29K to 185.31K xcUSDT
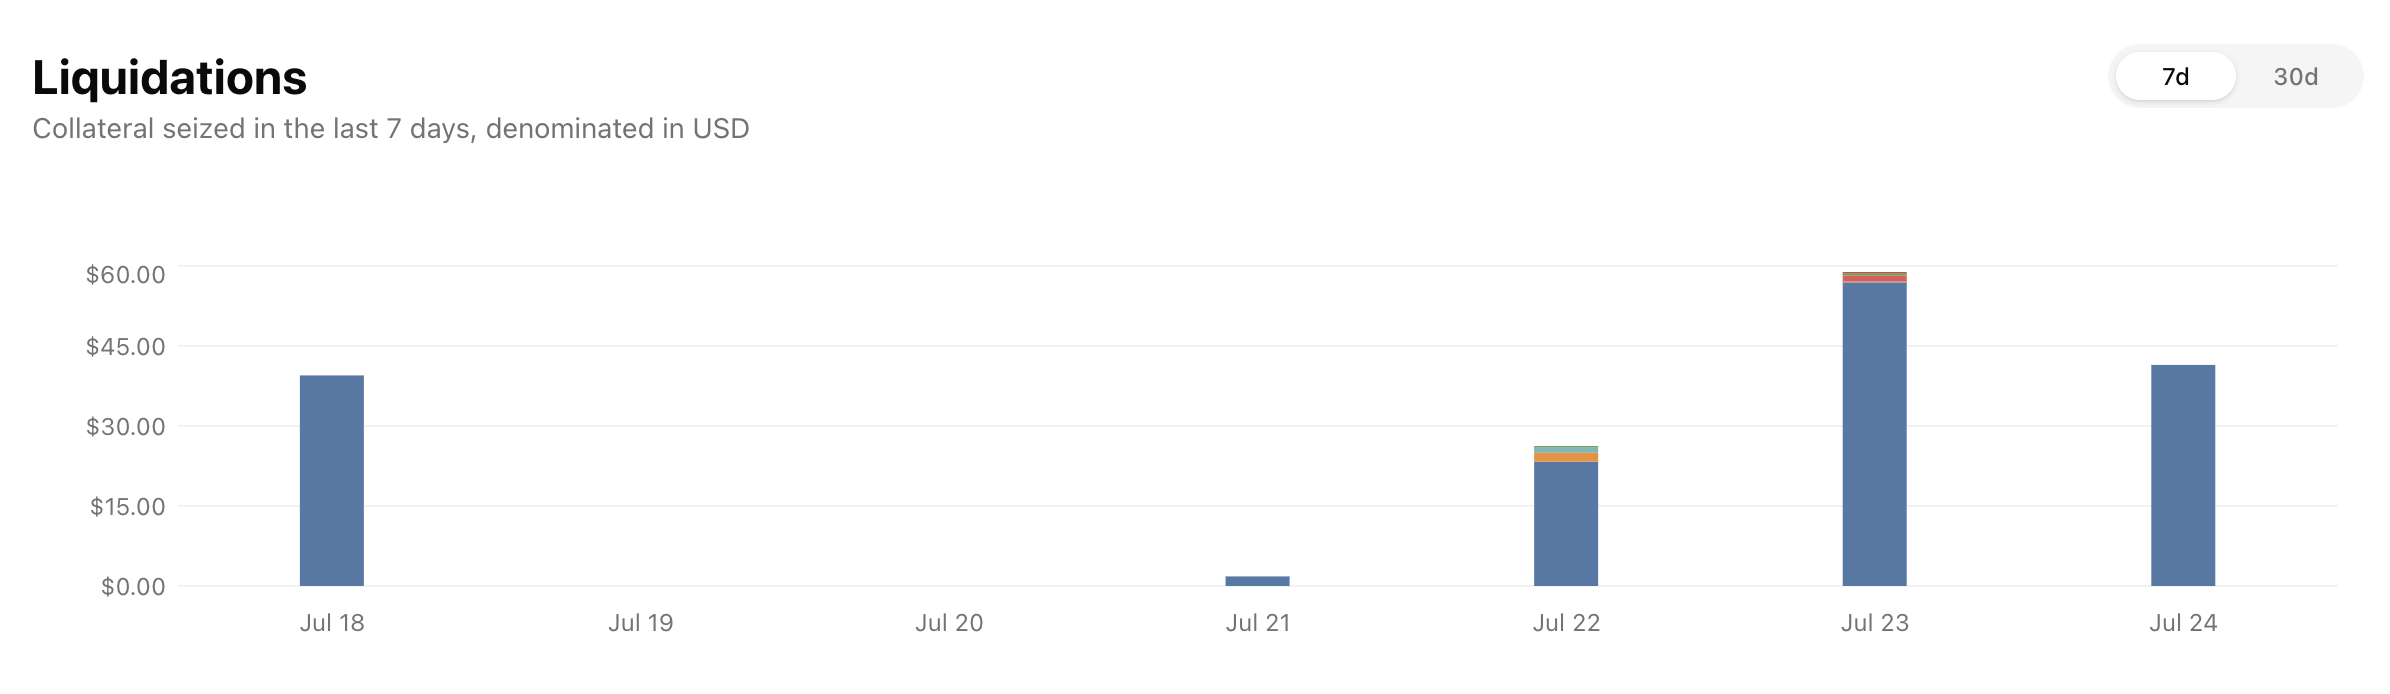
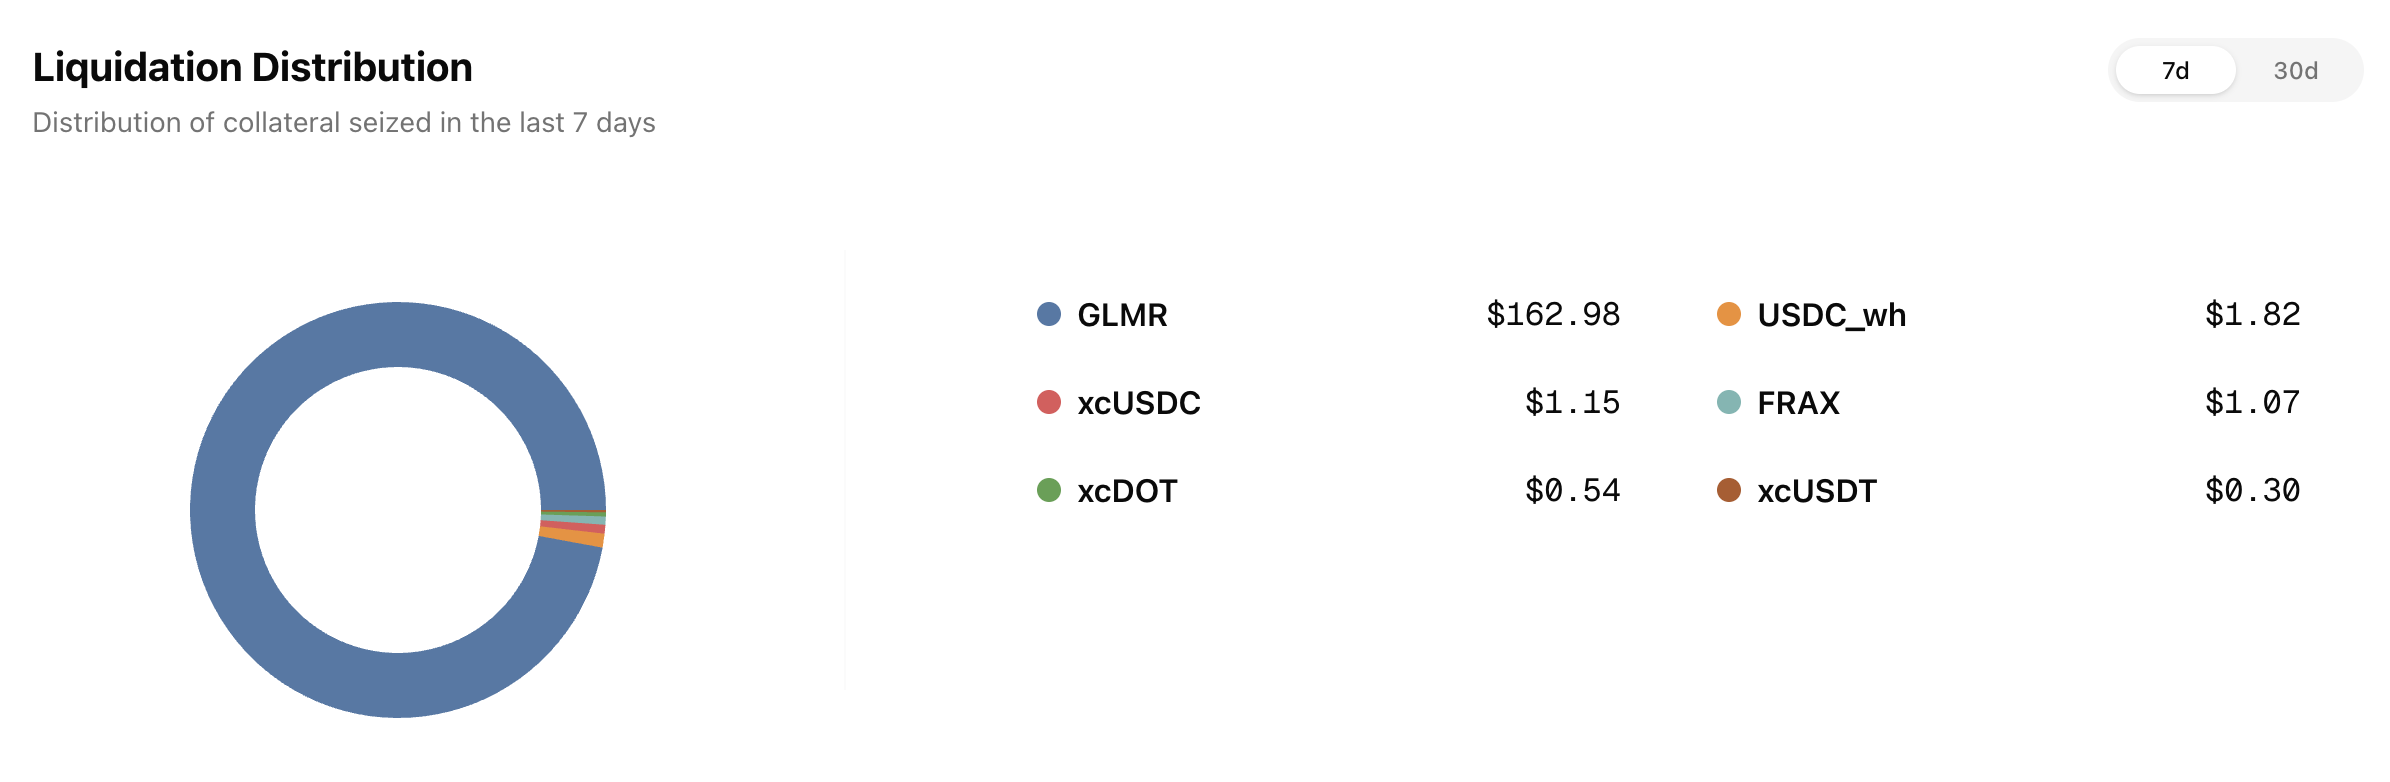
Total liquidations: 77Total Collateral Seized (USD): $167.85Total Debt Repaid (USD): $152.59Total Liquidation Bonus (USD): $15.26Total Liquidator Bonus (USD): $10.68Total Protocol Bonus (USD): $4.58
Asset
Total Seized (Tokens)
Total Seized (USD)
Debt Repaid (USD)
Liquidation Bonus (USD)
Liquidator Bonus (USD)
Protocol Bonus (USD)
Liquidation Count
GLMR
2,115.189055
$162.98
$148.16
$14.82
$10.37
$4.44
59
USDC_wh
1.815999
$1.82
$1.65
$0.17
$0.12
$0.05
10
xcUSDC
1.147642
$1.15
$1.04
$0.10
$0.07
$0.03
2
FRAX
1.069776
$1.07
$0.97
$0.10
$0.07
$0.03
2
xcDOT
0.125611
$0.54
$0.49
$0.05
$0.03
$0.01
2
xcUSDT
0.299774
$0.30
$0.27
$0.03
$0.02
$0.01
2
Asset
Current Borrow Cap
Average Borrow Cap Usage (Past Week)
Average Utilization
xcKSM
0.10
6.79M%
42.93%
FRAX
0.10
64.33M%
19.64%
MOVR
0.10
3.80M%
2.52%
Asset
Total Borrow
Total Supply
Utilization
xcKSM
+0% from 6.78K xcKSM to 6.79K xcKSM
-1% from 15.96K xcKSM to 15.81K xcKSM
+1% from 42.50% to 42.97%
FRAX
+0% from 64.30K FRAX to 64.34K FRAX
+2% from 321.69K FRAX to 328.58K FRAX
-2% from 19.99% to 19.58%
MOVR
+0% from 3.80K MOVR to 3.80K MOVR
+1% from 151.09K MOVR to 152.15K MOVR
-1% from 2.52% to 2.50%
No liquidation events on Moonriver this week.
3 Likes
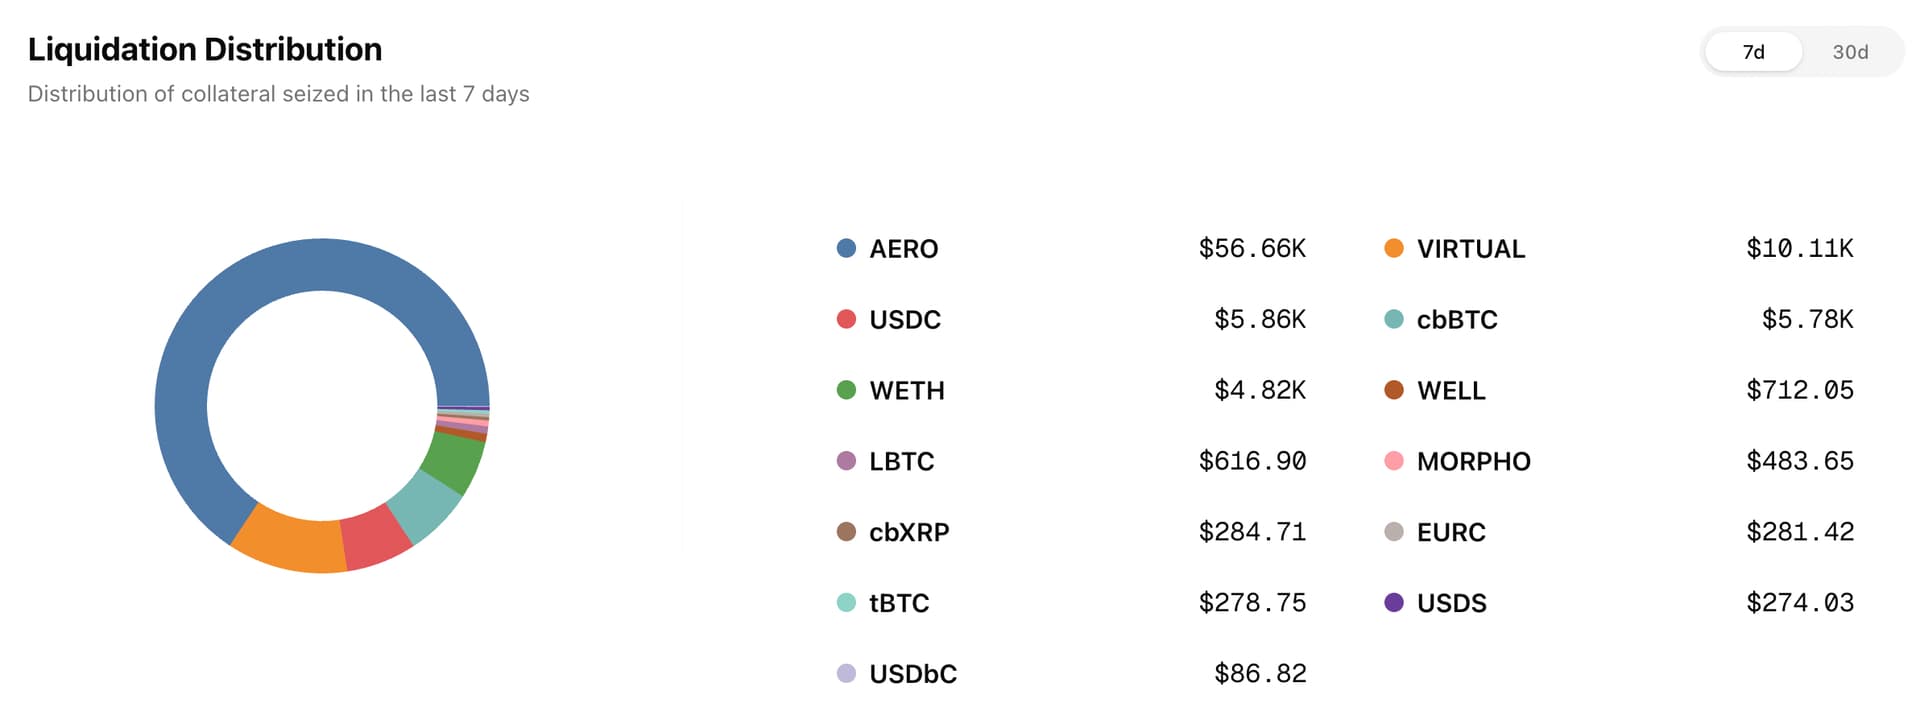
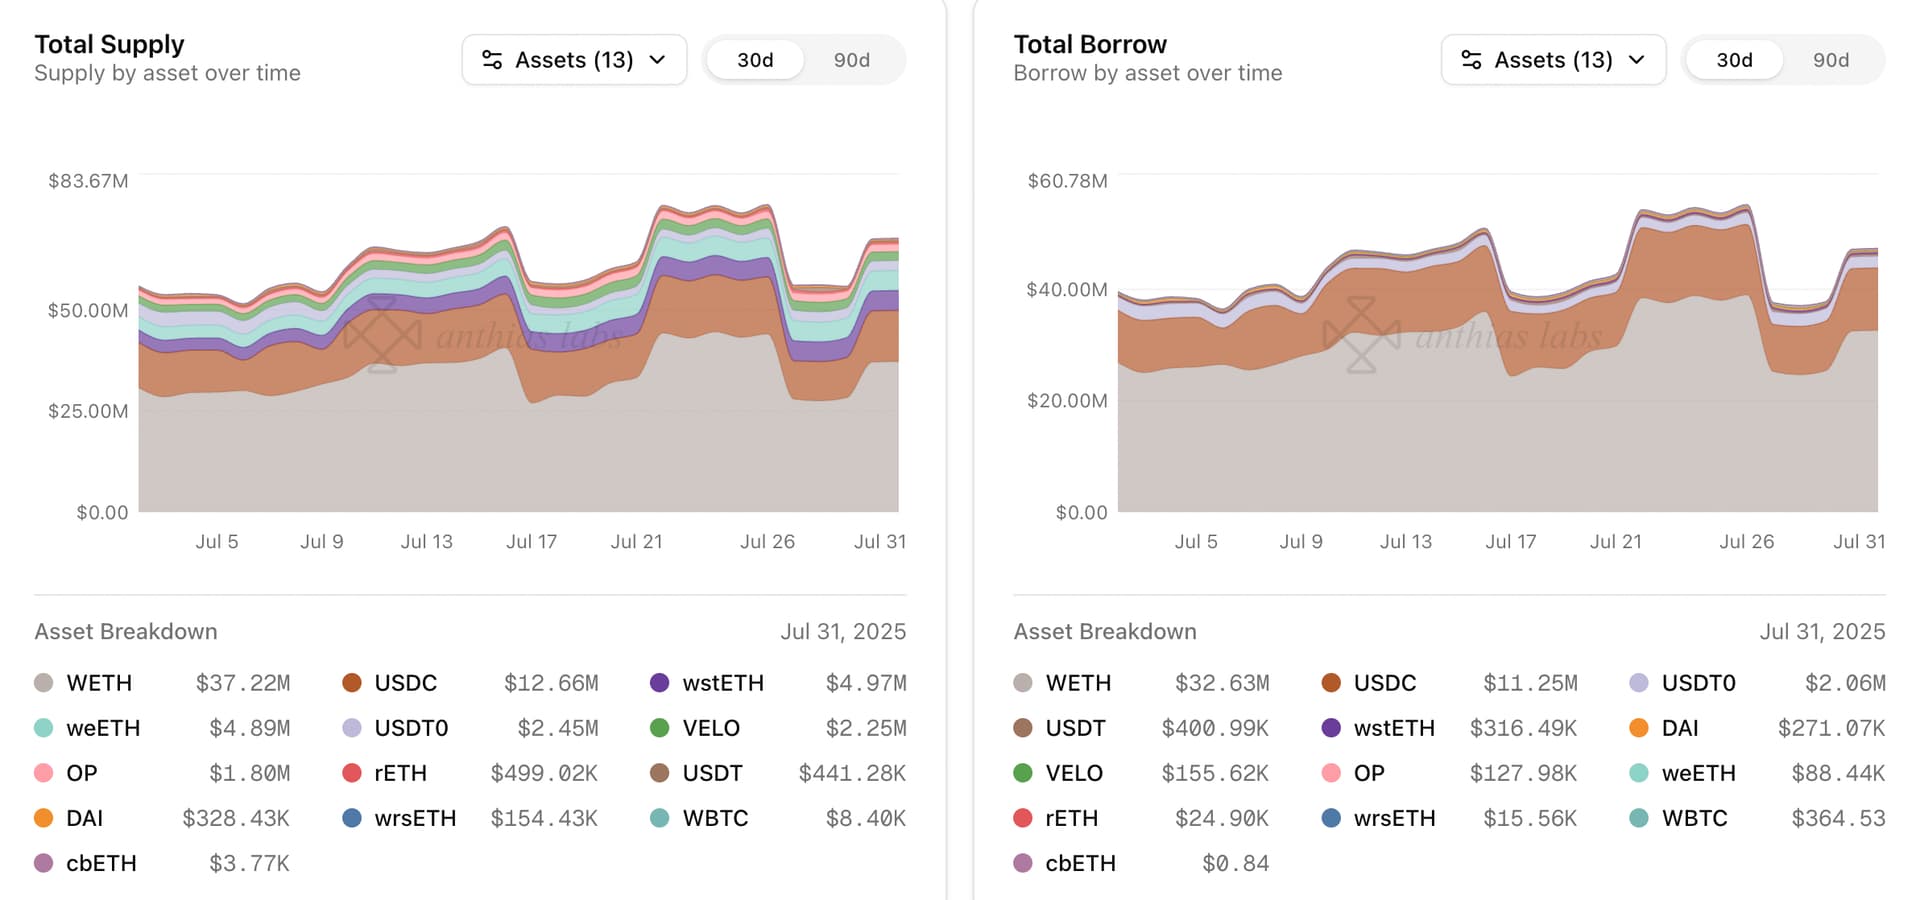
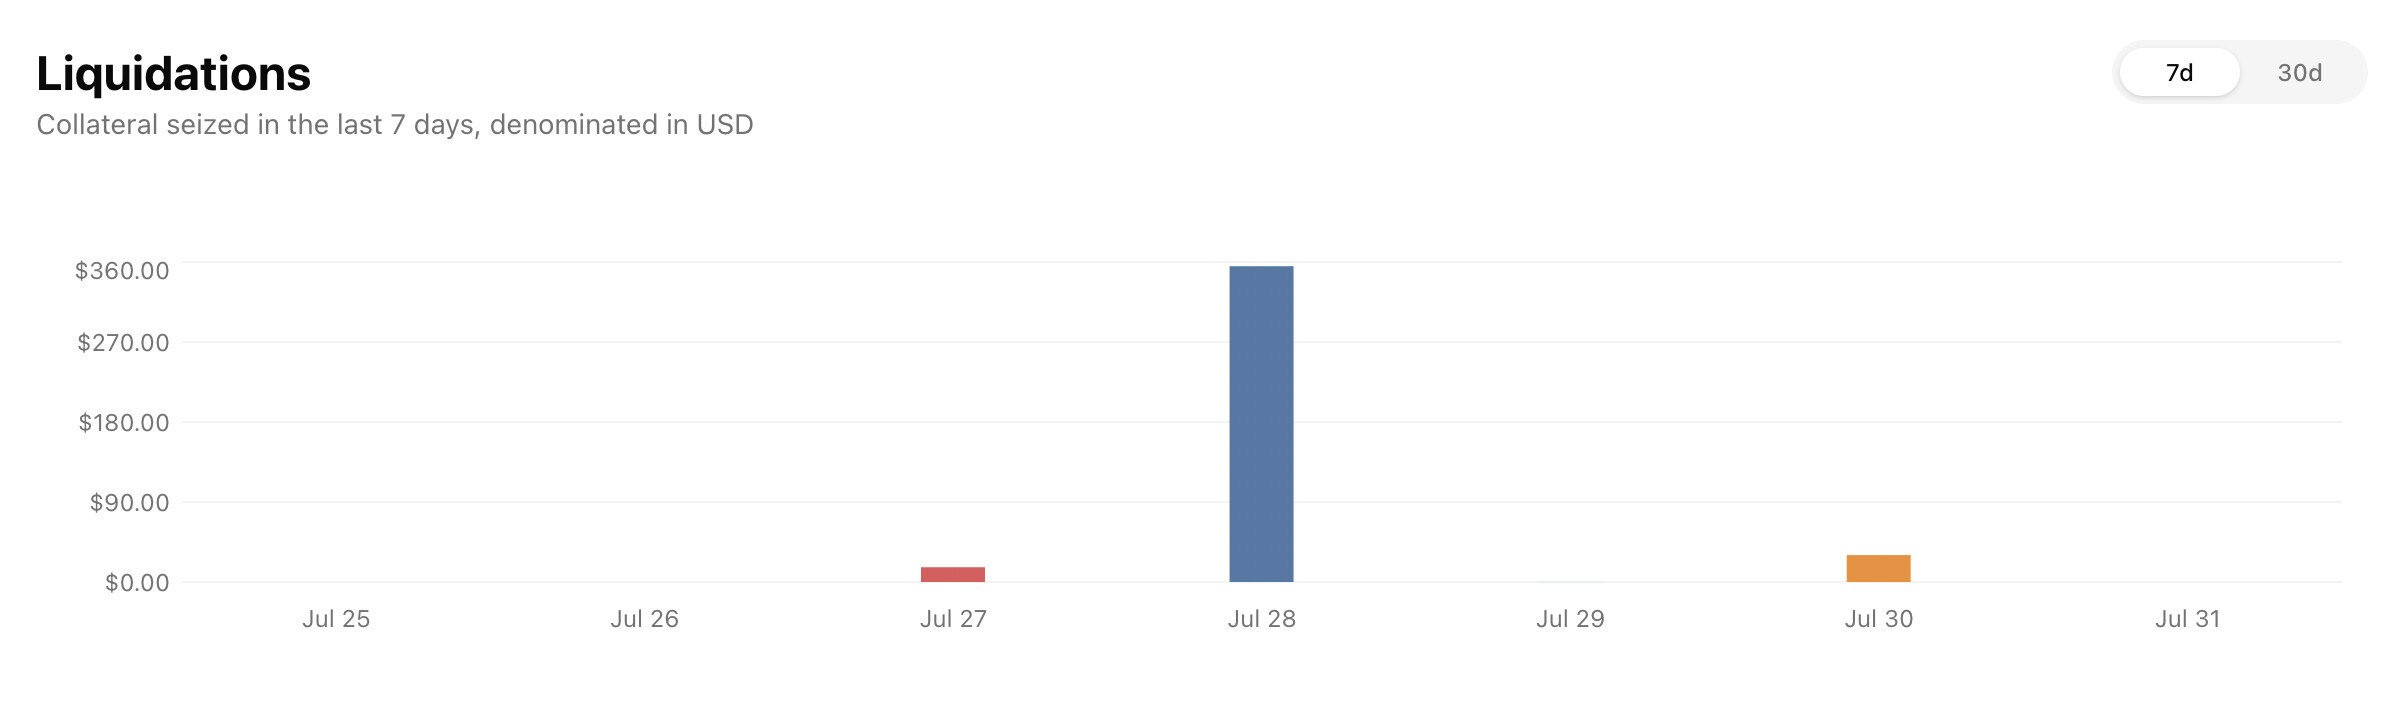
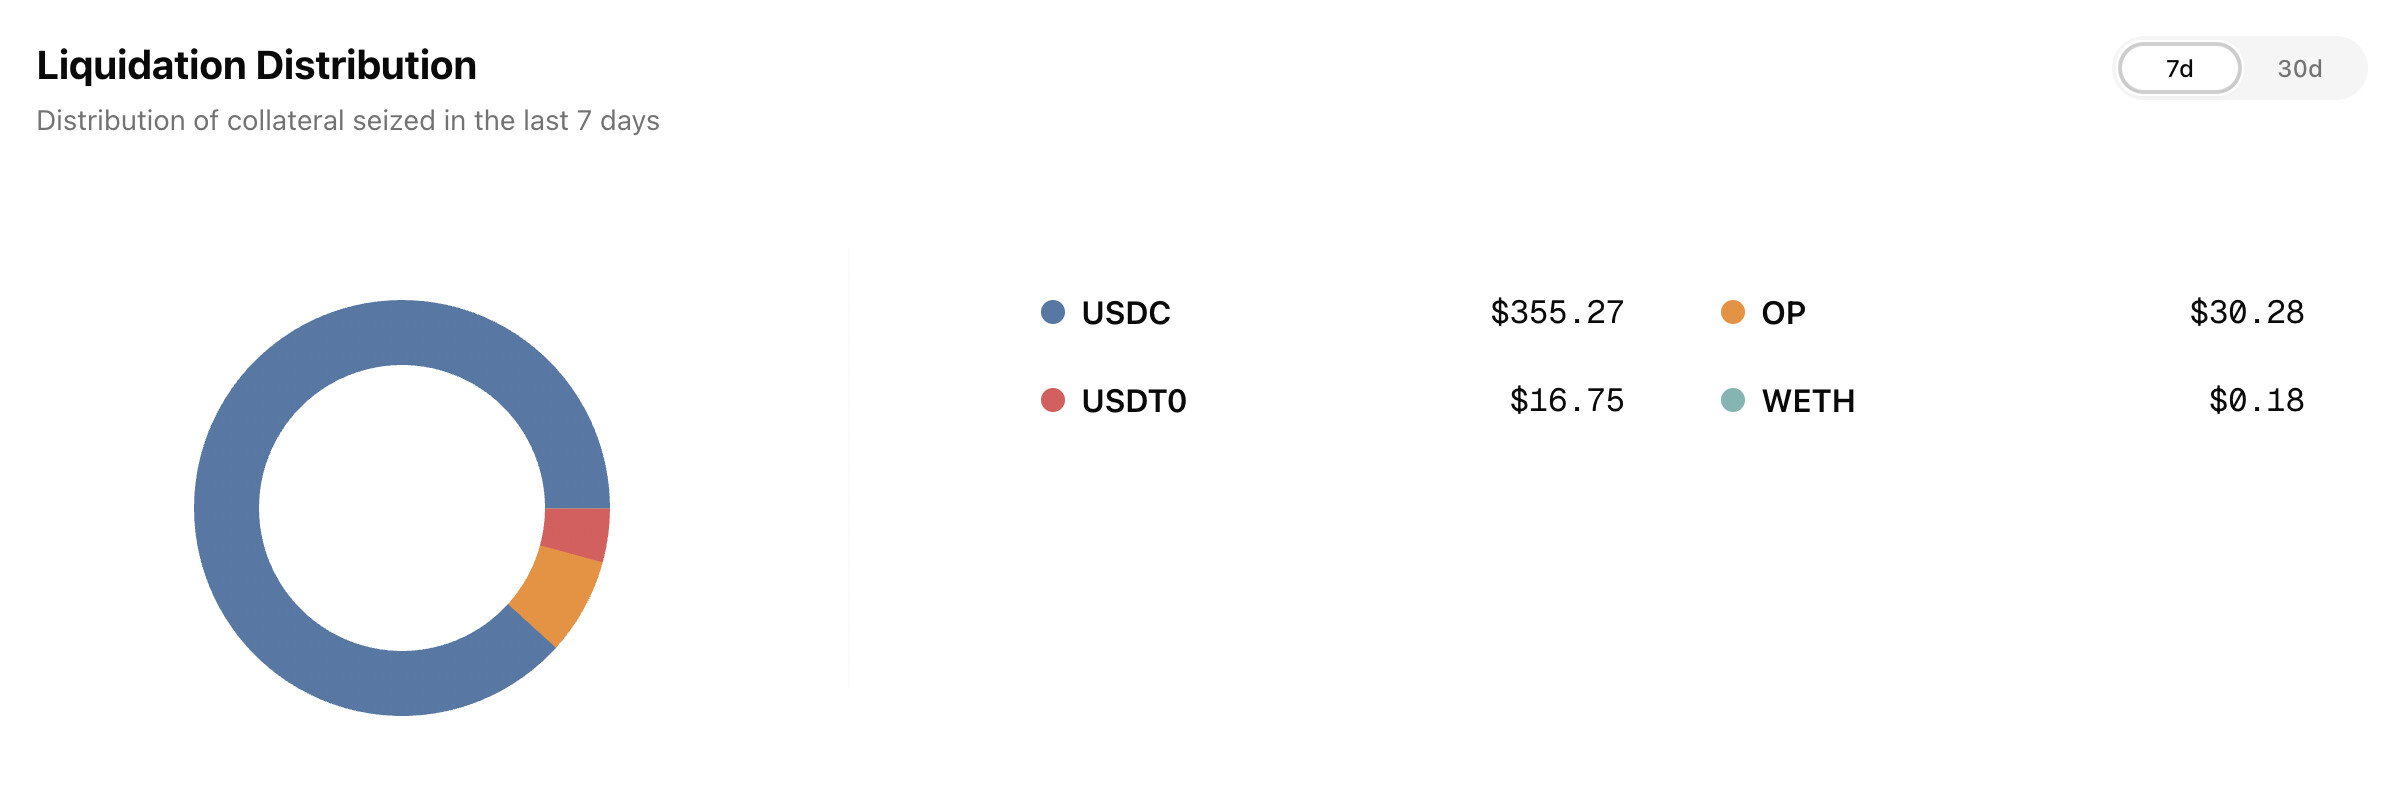
Anthias Labs would like to provide an update on market performance over the past week for Core markets on Base, Optimism, Moonbeam, and Moonriver. Data from 7/25/25 to 7/31/25. More information can be found on our monitoring dashboard .
Asset
Current Borrow Cap
Current Supply Cap
Average Borrow Cap Usage (Past Week)
Average Supply Cap Usage (Past Week)
Average Utilization
USDC
184.00M
200.00M
38.90%
39.82%
89.86%
WETH
64.00K
96.00K
39.65%
29.92%
88.34%
USDS
690.00K
750.00K
3.19%
3.70%
80.62%
EURC
21.00M
21.90M
19.56%
24.21%
77.96%
DAI
300.00K
400.00K
6.46%
7.85%
61.79%
AERO
25.00M
70.00M
41.58%
37.77%
39.32%
tBTC
36.00
90.00
10.21%
11.33%
36.03%
LBTC
38.00
95.00
30.49%
52.05%
23.44%
WELL
75.00M
220.00M
38.51%
70.57%
18.60%
cbXRP
500.00K
2.00M
32.48%
44.92%
17.92%
VIRTUAL
2.30M
4.50M
15.50%
46.29%
17.13%
cbBTC
640.00
1.50K
19.26%
48.46%
16.95%
USDbC
1.00
1.00
151.94K%
1.02M%
14.84%
MORPHO
1.00M
6.00M
52.62%
67.25%
13.04%
wstETH
4.80K
14.40K
3.77%
40.96%
3.07%
cbETH
6.40K
16.00K
1.10%
17.50%
2.51%
weETH
700.00
4.00K
4.89%
52.56%
1.63%
rETH
900.00
2.60K
2.24%
49.53%
1.57%
wrsETH
430.00
1.00K
0.06%
15.16%
0.18%
Asset
Total Borrow
Total Supply
Utilization
USDC
-11% from 76.32M USDC to 68.18M USDC
-10% from 84.26M USDC to 75.62M USDC
-0% from 90.59% to 90.15%
WETH
+0% from 26.41K WETH to 26.42K WETH
-1% from 30.07K WETH to 29.66K WETH
+1% from 87.84% to 89.06%
USDS
-40% from 33.19K USDS to 19.81K USDS -33% from 33.22K USDS to 22.27K USDS
-11% from 99.89% to 88.93%
EURC
-11% from 4.32M EURC to 3.83M EURC
-23% from 5.56M EURC to 4.26M EURC
+15% from 77.74% to 89.75%
DAI
-5% from 19.82K DAI to 18.92K DAI
+0% from 31.37K DAI to 31.40K DAI
-5% from 63.20% to 60.26%
AERO
-9% from 10.37M AERO to 9.42M AERO
+0% from 26.38M AERO to 26.50M AERO
-10% from 39.31% to 35.57%
tBTC
-34% from 3.96 tBTC to 2.60 tBTC
-7% from 10.97 tBTC to 10.19 tBTC
-29% from 36.08% to 25.50%
LBTC
-15% from 13.93 LBTC to 11.79 LBTC
-1% from 50.79 LBTC to 50.24 LBTC
-14% from 27.42% to 23.48%
WELL
+4% from 27.86M WELL to 28.88M WELL
+4% from 151.29M WELL to 157.68M WELL
-1% from 18.41% to 18.31%
cbXRP
+28% from 135.27K cbXRP to 173.64K cbXRP
+24% from 801.92K cbXRP to 996.75K cbXRP
+3% from 16.87% to 17.42%
VIRTUAL
+29% from 381.69K VIRTUAL to 491.30K VIRTUAL
+1% from 2.14M VIRTUAL to 2.16M VIRTUAL
+28% from 17.84% to 22.78%
cbBTC
+10% from 120.31 cbBTC to 132.17 cbBTC
+2% from 724.42 cbBTC to 736.19 cbBTC
+8% from 16.61% to 17.95%
USDbC
+0% from 1.52K USDbC to 1.52K USDbC
-1% from 10.29K USDbC to 10.19K USDbC
+1% from 14.77% to 14.91%
MORPHO
+3% from 527.47K MORPHO to 541.24K MORPHO
+2% from 4.00M MORPHO to 4.09M MORPHO
+0% from 13.18% to 13.24%
wstETH
+135% from 88.48 wstETH to 208.17 wstETH -2% from 6.00K wstETH to 5.86K wstETH
+141% from 1.47% to 3.55%
cbETH
+51% from 65.16 cbETH to 98.64 cbETH -2% from 2.84K cbETH to 2.78K cbETH
+54% from 2.30% to 3.54%
weETH
+49% from 29.97 weETH to 44.56 weETH +4% from 2.17K weETH to 2.25K weETH
+43% from 1.38% to 1.98%
rETH
+29% from 15.67 rETH to 20.17 rETH
-0% from 1.29K rETH to 1.29K rETH
+29% from 1.21% to 1.56%
wrsETH
-90% from 2.21 wrsETH to 0.21 wrsETH -0% from 152.03 wrsETH to 151.67 wrsETH
-90% from 1.46% to 0.14%
wstETH borrows increased 135% from 88.48 to 208.17 wstETH
cbETH borrows increased 51% from 65.16 to 98.64 cbETH
weETH borrows increased 49% from 29.97 to 44.56 weETH
Total liquidations: 84
Total Collateral Seized (USD): $86,191.09
Total Debt Repaid (USD): $78,355.53
Total Liquidation Bonus (USD): $7,835.55
Total Liquidator Bonus (USD): $5,484.89
Total Protocol Bonus (USD): $2,350.67
Asset
Total Seized (Tokens)
Total Seized (USD)
Debt Repaid (USD)
Liquidation Bonus (USD)
Liquidator Bonus (USD)
Protocol Bonus (USD)
Liquidation Count
AERO
68,246.462780
$56,656.39
$51,505.81
$5,150.58
$3,605.41
$1,545.17
20
VIRTUAL
7,669.819780
$10,077.60
$9,161.46
$916.15
$641.30
$274.84
10
USDC
5,861.570950
$5,861.00
$5,328.18
$532.82
$372.97
$159.85
13
cbBTC
0.049880
$5,780.59
$5,255.08
$525.51
$367.86
$157.65
4
WETH
1.276462
$4,797.18
$4,361.07
$436.11
$305.27
$130.83
21
WELL
21,897.860000
$712.05
$647.32
$64.73
$45.31
$19.42
2
LBTC
0.005234
$616.90
$560.82
$56.08
$39.26
$16.82
2
MORPHO
245.111000
$483.65
$439.68
$43.97
$30.78
$13.19
1
cbXRP
93.677970
$284.71
$258.83
$25.88
$18.12
$7.76
2
EURC
246.693600
$281.42
$255.83
$25.58
$17.91
$7.68
2
tBTC
0.002388
$278.75
$253.41
$25.34
$17.74
$7.60
5
USDS
274.060000
$274.03
$249.12
$24.91
$17.44
$7.47
1
USDbC
86.828900
$86.82
$78.92
$7.89
$5.52
$2.37
1
Asset
Current Borrow Cap
Current Supply Cap
Average Borrow Cap Usage (Past Week)
Average Supply Cap Usage (Past Week)
Average Utilization
USDC
34.00M
36.40M
31.82%
33.17%
89.61%
USDT0
8.00M
10.00M
26.08%
23.45%
89.03%
WETH
30.00K
32.00K
28.31%
29.94%
88.81%
DAI
4.50M
4.80M
7.53%
8.26%
85.25%
USDT
18.40M
22.60M
1.75%
2.27%
76.64%
wrsETH
160.00
400.00
2.44%
9.68%
10.08%
rETH
340.00
750.00
3.29%
16.77%
9.05%
wstETH
1.50K
5.00K
4.89%
21.52%
6.82%
VELO
20.00M
68.00M
14.11%
63.08%
6.58%
OP
650.00K
5.60M
25.26%
45.38%
6.46%
WBTC
0.00
0.00
0.00%
0.00%
4.32%
weETH
220.00
1.20K
9.81%
100.00%
1.80%
cbETH
0.00
10.00
0.00%
9.00%
0.02%
Asset
Total Borrow
Total Supply
Utilization
USDC
-26% from 12.65M USDC to 9.33M USDC
-26% from 14.12M USDC to 10.44M USDC
-0% from 89.56% to 89.39%
USDT0
+13% from 1.79M USDT0 to 2.03M USDT0
+13% from 1.99M USDT0 to 2.25M USDT0
+0% from 90.02% to 90.41%
WETH
-33% from 10.42K WETH to 6.95K WETH
-35% from 11.95K WETH to 7.74K WETH
+3% from 87.24% to 89.74%
DAI
-29% from 382.16K DAI to 271.10K DAI
-25% from 439.44K DAI to 328.68K DAI
-5% from 86.96% to 82.48%
USDT
-0% from 256.12K USDT to 255.27K USDT
-2% from 326.34K USDT to 321.26K USDT
+1% from 78.48% to 79.46%
wrsETH
0% from 3.90 wrsETH to 3.90 wrsETH
0% from 38.72 wrsETH to 38.72 wrsETH
0% from 10.08% to 10.08%
rETH
-59% from 14.08 rETH to 5.76 rETH +22% from 95.08 rETH to 115.66 rETH
-66% from 14.81% to 4.98%
wstETH
-3% from 71.03 wstETH to 68.88 wstETH
-2% from 1.07K wstETH to 1.05K wstETH
-1% from 6.63% to 6.57%
VELO
-3% from 2.78M VELO to 2.71M VELO
+2% from 42.52M VELO to 43.38M VELO
-4% from 6.54% to 6.25%
OP
+44% from 124.96K OP to 179.75K OP -1% from 2.56M OP to 2.55M OP
+45% from 4.88% to 7.06%
WBTC
0% from 0.00 WBTC to 0.00 WBTC
0% from 0.07 WBTC to 0.07 WBTC
0% from 4.32% to 4.32%
weETH
-1% from 21.82 weETH to 21.70 weETH
-0% from 1.20K weETH to 1.20K weETH
-1% from 1.82% to 1.81%
cbETH
0% from 0.00 cbETH to 0.00 cbETH
-0% from 0.90 cbETH to 0.90 cbETH
+0% from 0.02% to 0.02%
Total liquidations: 5
Total Collateral Seized (USD): $402.32
Total Debt Repaid (USD): $365.75
Total Liquidation Bonus (USD): $36.57
Total Liquidator Bonus (USD): $25.60
Total Protocol Bonus (USD): $10.97
Asset
Total Seized (Tokens)
Total Seized (USD)
Debt Repaid (USD)
Liquidation Bonus (USD)
Liquidator Bonus (USD)
Protocol Bonus (USD)
Liquidation Count
USDC
355.319060
$355.27
$322.97
$32.30
$22.61
$9.69
2
OP
43.883800
$30.28
$27.53
$2.75
$1.93
$0.83
1
USDT0
16.589300
$16.60
$15.09
$1.51
$1.06
$0.45
1
WETH
0.000046
$0.18
$0.16
$0.02
$0.01
$0.00
1
Asset
Current Borrow Cap
Average Borrow Cap Usage (Past Week)
Average Utilization
GLMR
0.10
6572.71M%
62.70%
xcUSDC
0.10
98.69M%
58.15%
xcUSDT
0.10
83.74M%
45.39%
USDC_wh
0.10
41.48M%
33.43%
xcDOT
0.10
23.16M%
4.32%
ETH_wh
0.10
1.28K%
2.67%
BTC_wh
0.10
22.39%
1.81%
FRAX
0.10
451.37K%
1.11%
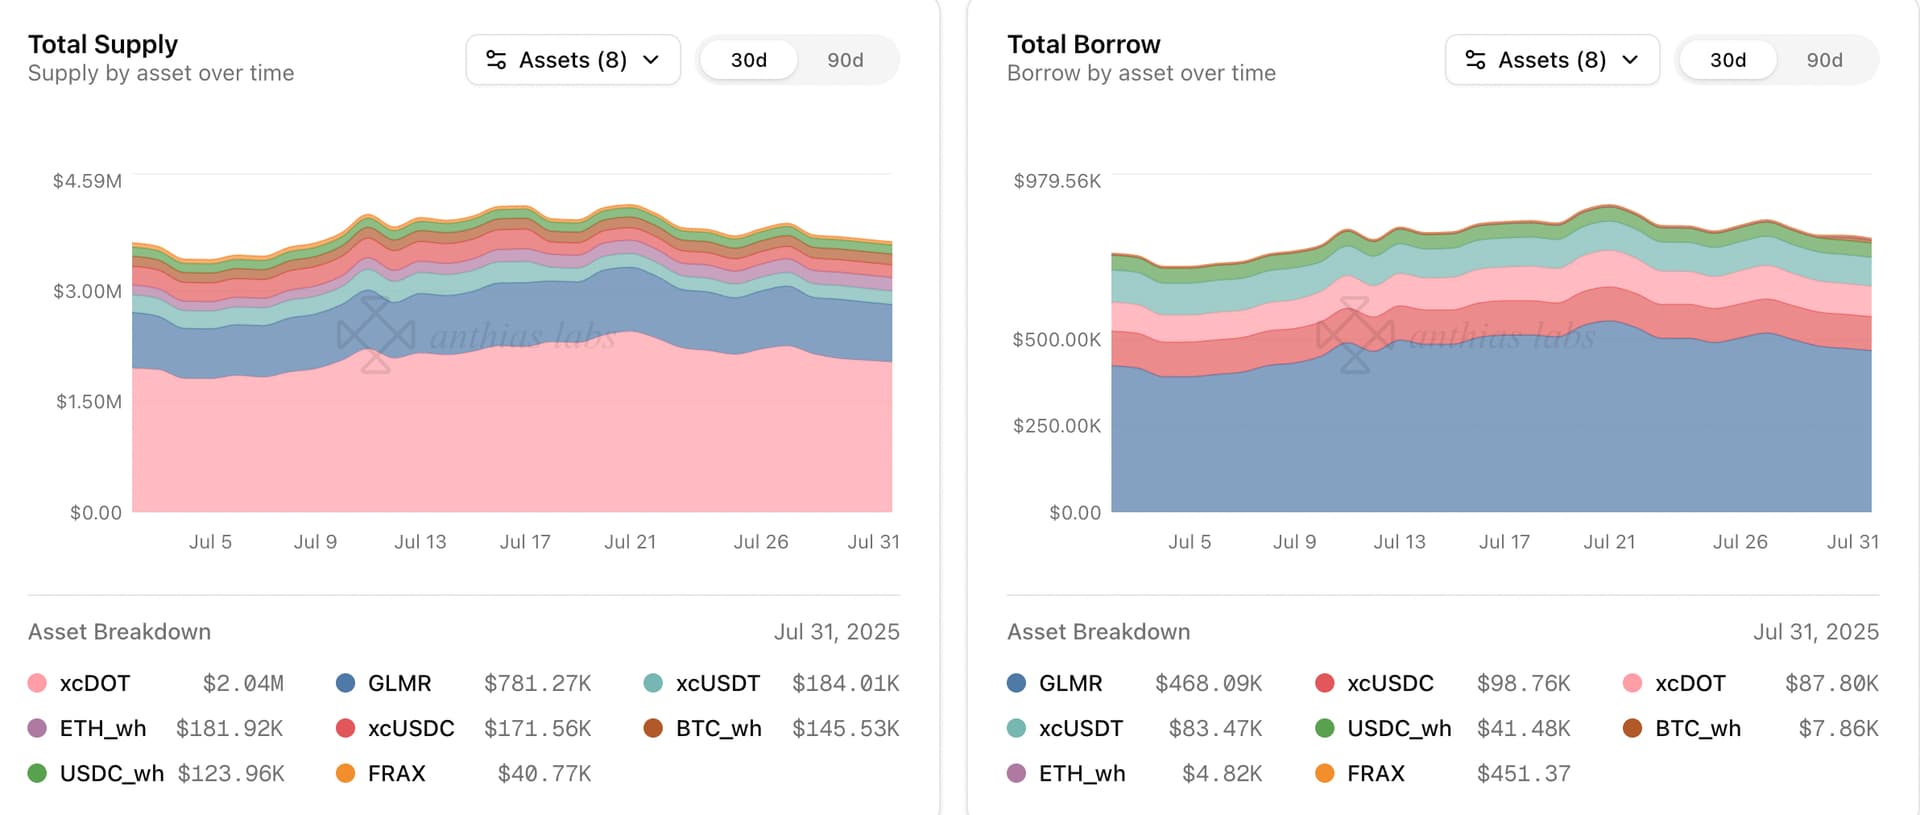
Asset
Total Borrow
Total Supply
Utilization
GLMR
+1% from 6.55M GLMR to 6.60M GLMR
+7% from 10.32M GLMR to 11.02M GLMR
-6% from 63.40% to 59.88%
xcUSDC
+0% from 98.60K xcUSDC to 98.76K xcUSDC
+0% from 168.60K xcUSDC to 169.18K xcUSDC
-0% from 58.48% to 58.38%
xcUSDT
-1% from 83.98K xcUSDT to 83.47K xcUSDT
-1% from 185.31K xcUSDT to 184.01K xcUSDT
+0% from 45.32% to 45.36%
USDC_wh
-0% from 41.49K USDC_wh to 41.48K USDC_wh
-1% from 124.94K USDC_wh to 123.96K USDC_wh
+1% from 33.21% to 33.46%
xcDOT
-0% from 23.19K xcDOT to 23.14K xcDOT
-0% from 536.60K xcDOT to 536.55K xcDOT
-0% from 4.32% to 4.31%
ETH_wh
-2% from 1.29 ETH_wh to 1.27 ETH_wh
+0% from 47.96 ETH_wh to 47.96 ETH_wh
-2% from 2.70% to 2.65%
BTC_wh
+1391% from 0.01 BTC_wh to 0.10 BTC_wh -0% from 1.24 BTC_wh to 1.24 BTC_wh
+1390% from 0.54% to 8.09%
FRAX
+0% from 451.37 FRAX to 451.37 FRAX
-0% from 40.77K FRAX to 40.77K FRAX
+0% from 1.11% to 1.11%
Total liquidations: 16
Total Collateral Seized (USD): $124.33
Total Debt Repaid (USD): $113.03
Total Liquidation Bonus (USD): $11.30
Total Liquidator Bonus (USD): $7.91
Total Protocol Bonus (USD): $3.39
Asset
Total Seized (Tokens)
Total Seized (USD)
Debt Repaid (USD)
Liquidation Bonus (USD)
Liquidator Bonus (USD)
Protocol Bonus (USD)
Liquidation Count
GLMR
1,652.792324
$120.32
$109.38
$10.94
$7.66
$3.28
10
xcDOT
1.030632
$4.02
$3.65
$0.37
$0.26
$0.11
6
Asset
Current Borrow Cap
Average Borrow Cap Usage (Past Week)
Average Utilization
xcKSM
0.10
6.79M%
42.96%
FRAX
0.10
64.35M%
19.57%
MOVR
0.10
3.80M%
2.52%
Asset
Total Borrow
Total Supply
Utilization
xcKSM
+0% from 6.79K xcKSM to 6.80K xcKSM
+0% from 15.81K xcKSM to 15.83K xcKSM
-0% from 42.97% to 42.96%
FRAX
+0% from 64.34K FRAX to 64.35K FRAX
+0% from 328.58K FRAX to 328.76K FRAX
-0% from 19.58% to 19.57%
MOVR
+0% from 3.80K MOVR to 3.80K MOVR
-2% from 152.15K MOVR to 149.55K MOVR
+2% from 2.50% to 2.54%
No liquidation events on Moonriver this week.
1 Like
nesde
August 1, 2025, 6:36am
9
Moonwell team is not helping us at all. Can anyone help us get our xcDot back?
3 Likes
what is the moonwell and moonbeam Team doing to provide enough liquidity for all those who supported the moonwell application for a long time. to be able to withdraw?
2 Likes
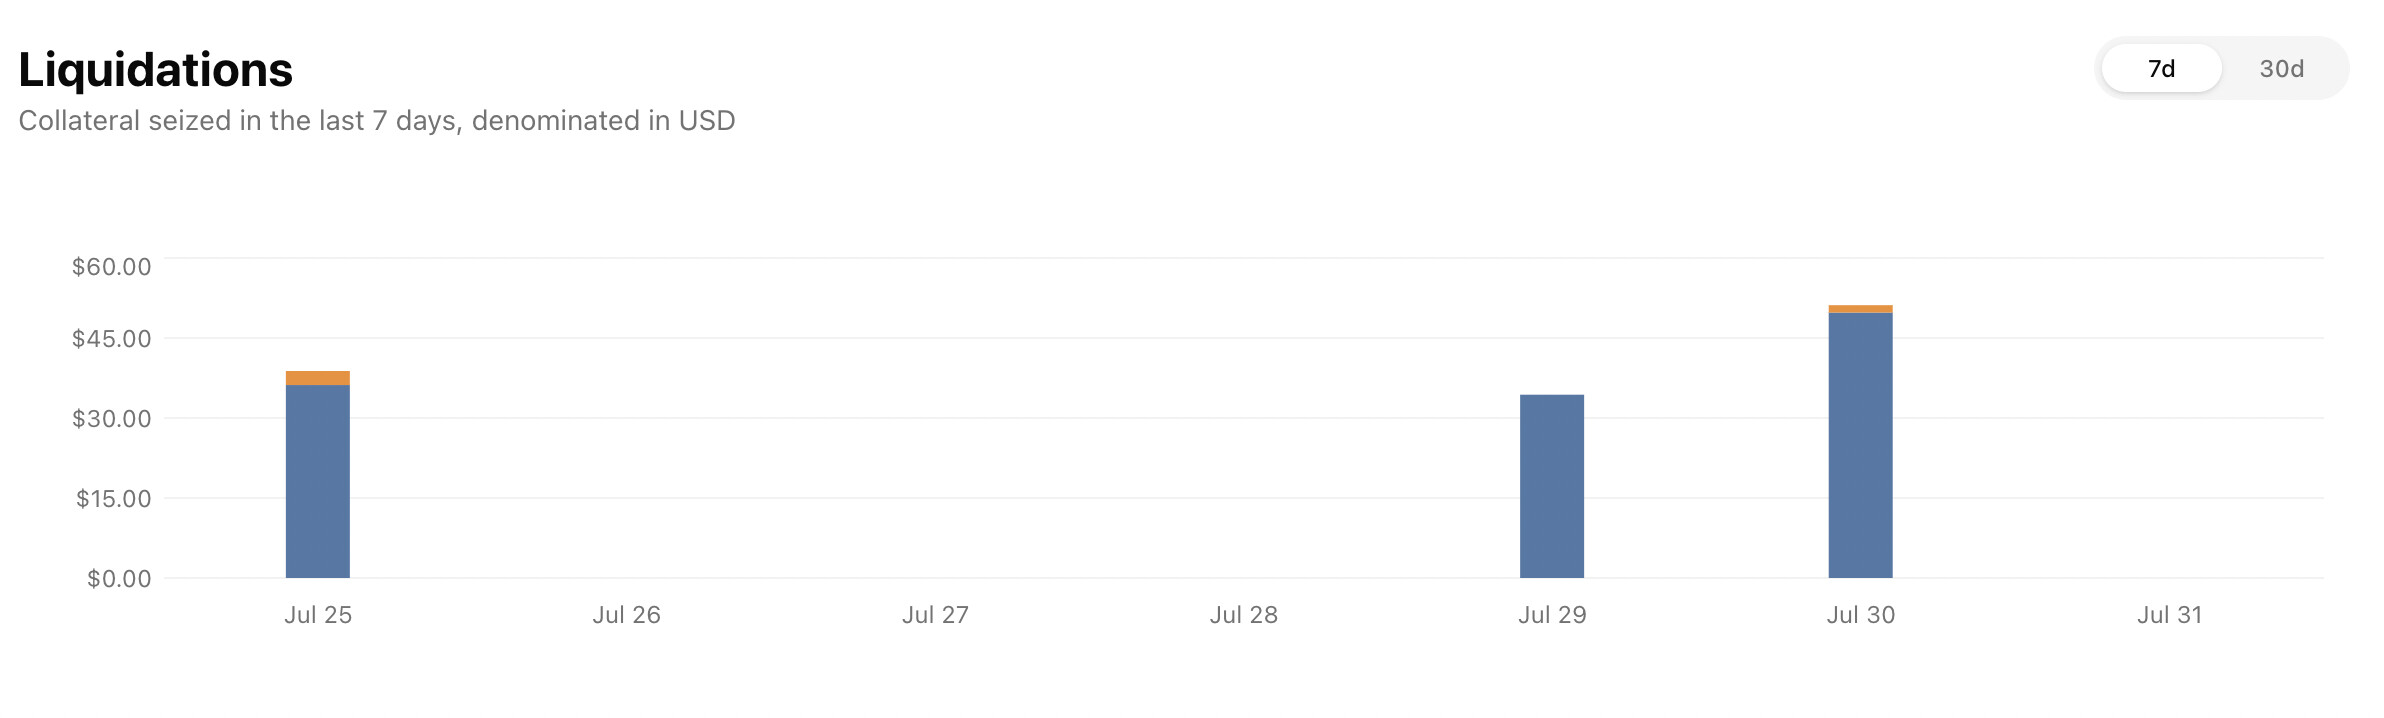
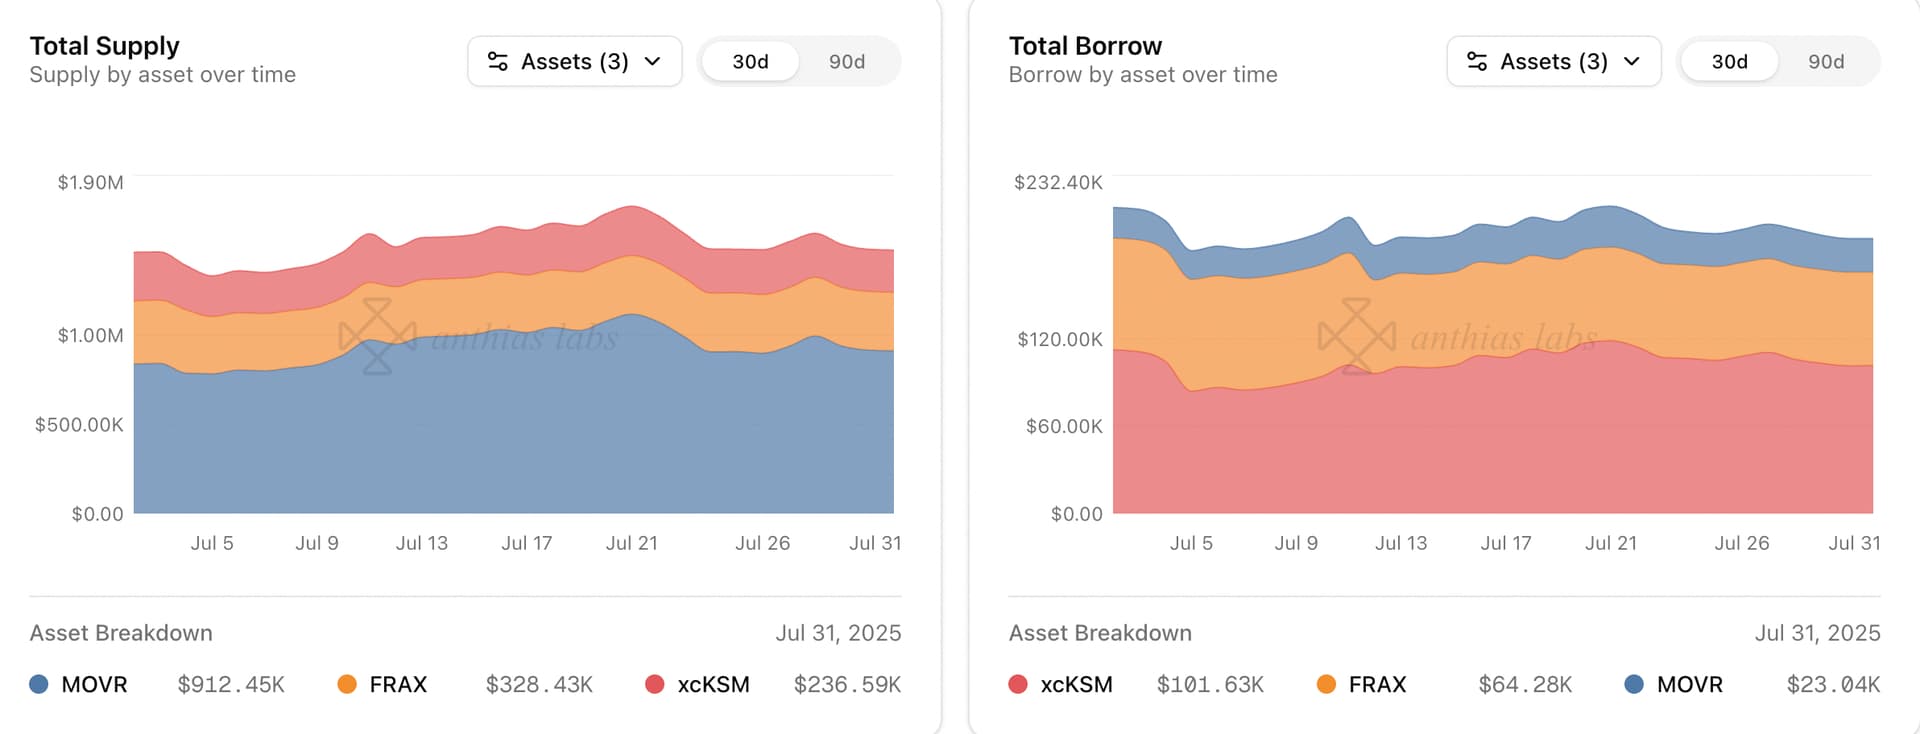
Anthias Labs would like to provide an update on market performance over the past week for Core markets on Base, Optimism, Moonbeam, and Moonriver. Data from 8/1/25 to 8/7/25. More information can be found on our monitoring dashboard .
Asset
Current Borrow Cap
Current Supply Cap
Average Borrow Cap Usage (Past Week)
Average Supply Cap Usage (Past Week)
Average Utilization
USDC
184.00M
200.00M
36.89%
37.69%
90.04%
USDS
690.00K
750.00K
2.66%
2.74%
89.16%
WETH
64.00K
96.00K
39.79%
29.83%
88.94%
EURC
21.00M
21.90M
15.25%
18.71%
78.26%
DAI
300.00K
400.00K
6.51%
7.86%
62.11%
AERO
25.00M
70.00M
36.72%
36.92%
35.55%
tBTC
36.00
90.00
6.93%
10.71%
25.93%
LBTC
38.00
95.00
30.68%
51.90%
23.66%
VIRTUAL
2.30M
4.50M
20.18%
44.47%
23.17%
WELL
75.00M
220.00M
41.57%
74.60%
18.99%
cbBTC
640.00
1.50K
19.81%
49.04%
17.23%
cbXRP
500.00K
2.00M
37.14%
59.07%
15.80%
USDbC
1.00
1.00
151.54K%
1.01M%
15.04%
MORPHO
1.00M
6.00M
56.90%
75.95%
12.84%
cbETH
6.40K
16.00K
1.47%
17.12%
3.42%
wstETH
4.80K
14.40K
3.48%
39.70%
2.91%
weETH
700.00
4.00K
8.03%
54.24%
2.61%
rETH
900.00
2.60K
1.75%
49.52%
1.23%
wrsETH
430.00
1.00K
0.05%
15.13%
0.14%
Asset
Total Borrow
Total Supply
Utilization
USDC
+10% from 67.64M USDC to 74.27M USDC
+10% from 74.78M USDC to 82.31M USDC
-0% from 90.44% to 90.23%
USDS
-32% from 19.81K USDS to 13.42K USDS
-28% from 22.27K USDS to 16.00K USDS
-6% from 88.93% to 83.83%
WETH
-21% from 26.42K WETH to 20.87K WETH
-21% from 29.66K WETH to 23.38K WETH
+0% from 89.07% to 89.27%
EURC
-25% from 3.83M EURC to 2.89M EURC
-20% from 4.27M EURC to 3.41M EURC
-6% from 89.76% to 84.78%
DAI
+4% from 18.92K DAI to 19.62K DAI
+0% from 31.40K DAI to 31.46K DAI
+3% from 60.26% to 62.36%
AERO
-10% from 9.44M AERO to 8.49M AERO
+2% from 26.49M AERO to 27.02M AERO
-12% from 35.65% to 31.43%
tBTC
+25% from 2.60 tBTC to 3.26 tBTC
-7% from 10.18 tBTC to 9.42 tBTC
+36% from 25.53% to 34.60%
LBTC
-3% from 11.79 LBTC to 11.43 LBTC
-9% from 50.24 LBTC to 45.77 LBTC
+6% from 23.48% to 24.96%
VIRTUAL
+7% from 473.04K VIRTUAL to 503.87K VIRTUAL
-4% from 2.14M VIRTUAL to 2.05M VIRTUAL
+11% from 22.14% to 24.60%
WELL
+17% from 28.89M WELL to 33.71M WELL
+6% from 157.86M WELL to 167.56M WELL
+10% from 18.30% to 20.12%
cbBTC
+0% from 132.18 cbBTC to 132.65 cbBTC
+1% from 736.27 cbBTC to 742.17 cbBTC
-0% from 17.95% to 17.87%
cbXRP
+16% from 175.83K cbXRP to 204.24K cbXRP
+32% from 1.00M cbXRP to 1.32M cbXRP
-12% from 17.58% to 15.47%
USDbC
-1% from 1.52K USDbC to 1.51K USDbC
-0% from 10.08K USDbC to 10.07K USDbC
-1% from 15.07% to 14.99%
MORPHO
+25% from 542.13K MORPHO to 680.31K MORPHO
+47% from 4.09M MORPHO to 6.00M MORPHO -14% from 13.26% to 11.34%
cbETH
-32% from 98.64 cbETH to 66.91 cbETH
-12% from 2.78K cbETH to 2.45K cbETH
-23% from 3.54% to 2.73%
wstETH
-45% from 208.17 wstETH to 113.57 wstETH -9% from 5.86K wstETH to 5.35K wstETH
-40% from 3.55% to 2.12%
weETH
-8% from 44.56 weETH to 41.18 weETH
+21% from 2.25K weETH to 2.72K weETH
-23% from 1.98% to 1.52%
rETH
-22% from 20.17 rETH to 15.68 rETH
-2% from 1.29K rETH to 1.27K rETH
-21% from 1.56% to 1.24%
wrsETH
0% from 0.21 wrsETH to 0.21 wrsETH
-1% from 151.67 wrsETH to 150.14 wrsETH
+1% from 0.14% to 0.14%
cbXRP supply increased 32% from 1.00M to 1.32M cbXRP
Morpho supply increaed 47% from 4.09M to 6.00M MORPHO
wstETH borrows decreased 45% from 208.17 to 113.57 wstETH
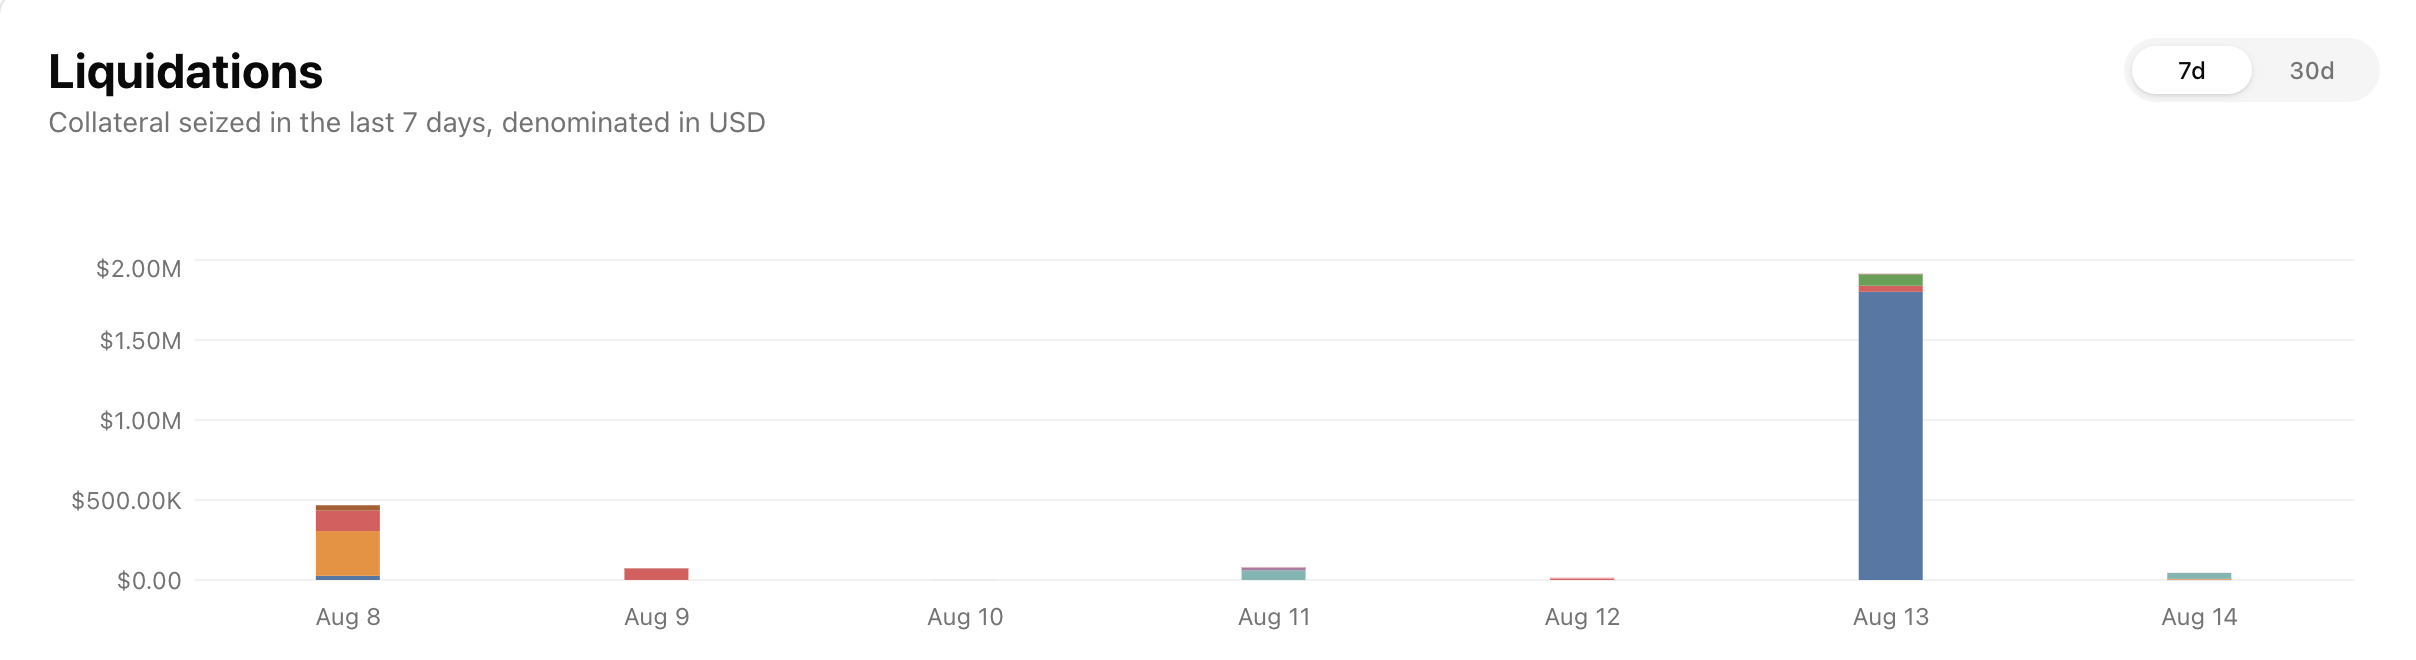
Total liquidations: 76Total Collateral Seized (USD): $166,535.77Total Debt Repaid (USD): $151,396.16Total Liquidation Bonus (USD): $15,139.62Total Liquidator Bonus (USD): $10,597.73Total Protocol Bonus (USD): $4,541.88
Asset
Total Seized (Tokens)
Total Seized (USD)
Debt Repaid (USD)
Liquidation Bonus (USD)
Liquidator Bonus (USD)
Protocol Bonus (USD)
Liquidation Count
USDC
56,676.294388
$56,663.96
$51,512.69
$5,151.27
$3,605.89
$1,545.38
13
AERO
58,180.786700
$43,209.39
$39,281.26
$3,928.13
$2,749.69
$1,178.44
18
cbXRP
7,654.142200
$22,509.03
$20,462.76
$2,046.28
$1,432.39
$613.88
5
WELL
788,061.104000
$21,844.29
$19,858.45
$1,985.84
$1,390.09
$595.75
8
WETH
3.588529
$12,412.91
$11,284.47
$1,128.45
$789.91
$338.53
17
cbBTC
0.047834
$5,448.59
$4,953.26
$495.33
$346.73
$148.60
5
MORPHO
1,278.998000
$2,228.12
$2,025.56
$202.56
$141.79
$60.77
2
wstETH
0.294369
$1,306.80
$1,188.00
$118.80
$83.16
$35.64
1
cbETH
0.124298
$470.31
$427.55
$42.76
$29.93
$12.83
2
VIRTUAL
266.230370
$303.36
$275.78
$27.58
$19.30
$8.27
2
wrsETH
0.028990
$107.55
$97.77
$9.78
$6.84
$2.93
1
tBTC
0.000153
$17.21
$15.64
$1.56
$1.09
$0.47
1
LBTC
0.000123
$14.24
$12.95
$1.29
$0.91
$0.39
1
Asset
Current Borrow Cap
Current Supply Cap
Average Borrow Cap Usage (Past Week)
Average Supply Cap Usage (Past Week)
Average Utilization
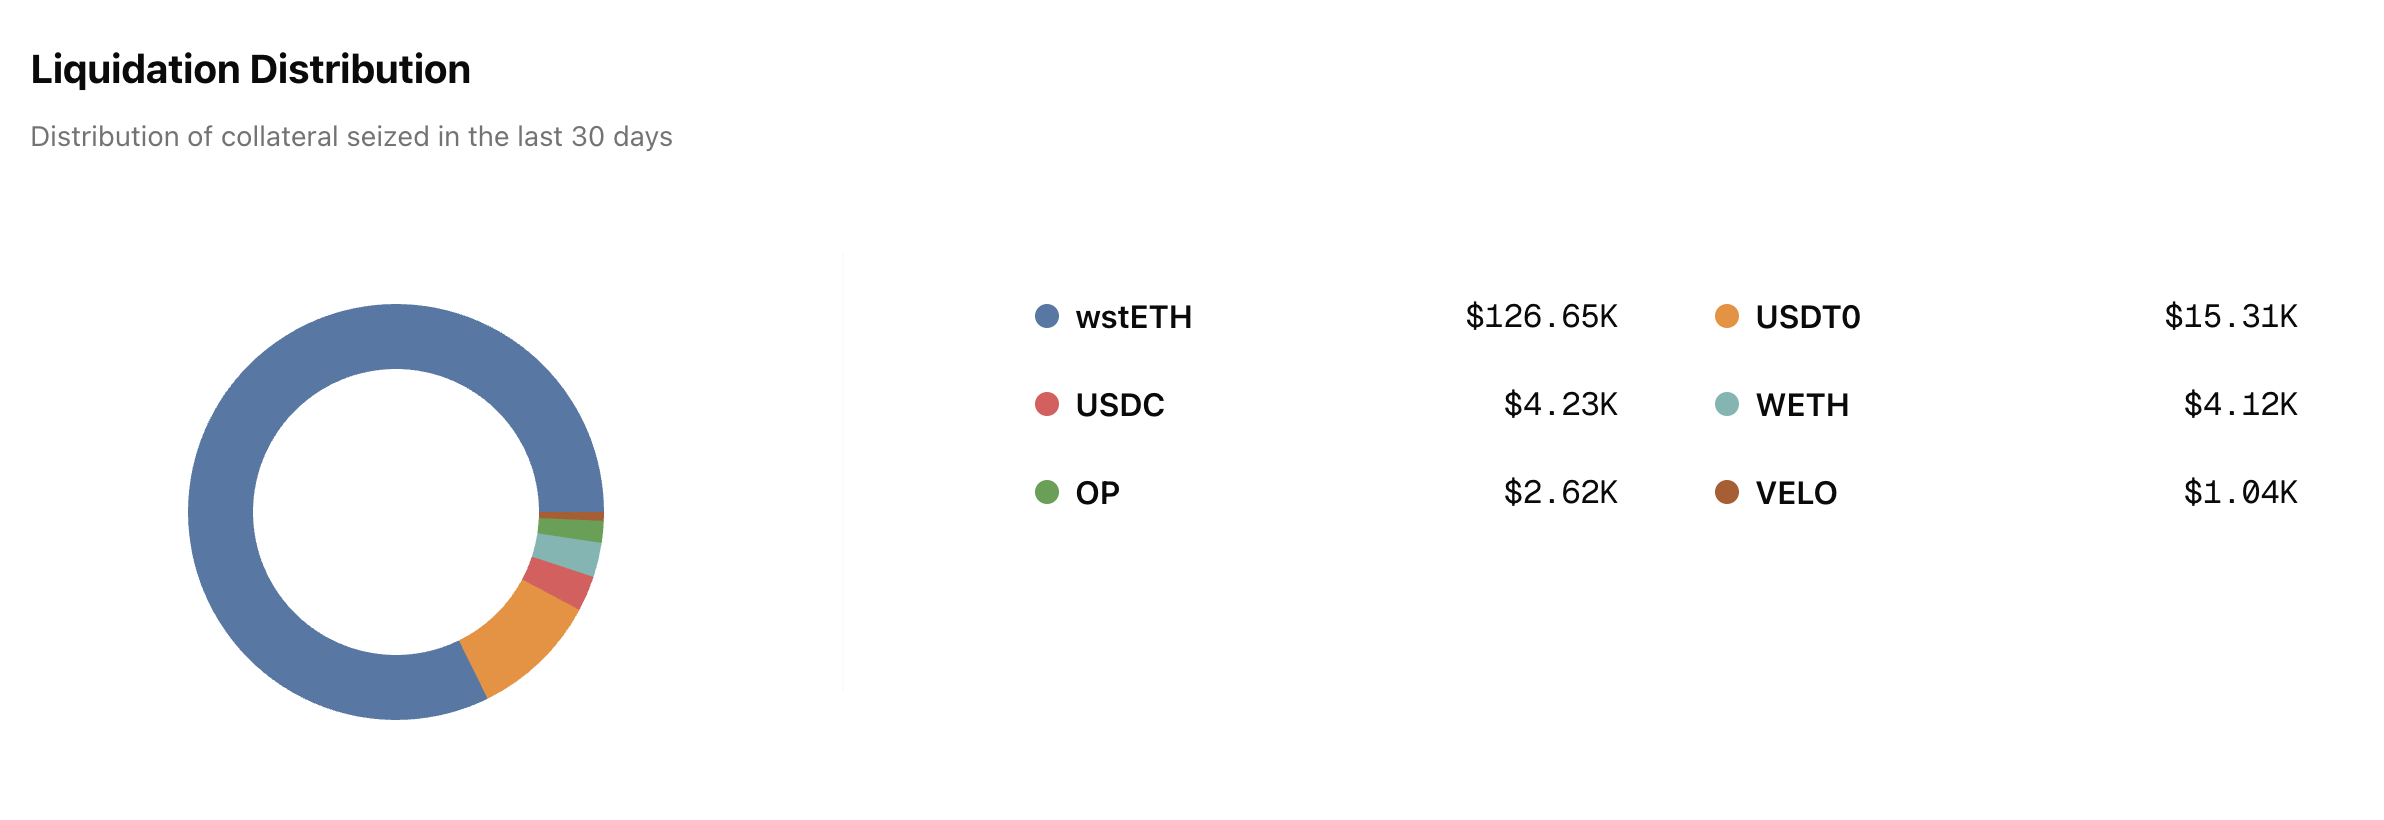
USDT0
8.00M
10.00M
21.90%
19.49%
89.88%
USDC
34.00M
36.40M
28.00%
29.15%
89.70%
WETH
30.00K
32.00K
24.50%
25.62%
89.67%
DAI
4.50M
4.80M
8.87%
9.29%
88.91%
USDT
18.40M
22.60M
2.31%
2.15%
86.76%
wrsETH
160.00
400.00
2.35%
9.25%
10.16%
OP
650.00K
5.60M
23.64%
44.50%
6.16%
VELO
20.00M
68.00M
13.25%
64.58%
6.03%
wstETH
1.50K
5.00K
3.69%
18.90%
5.86%
rETH
340.00
750.00
1.76%
15.96%
5.01%
WBTC
0.00
0.00
0.00%
0.00%
4.32%
weETH
220.00
1.20K
10.04%
100.01%
1.84%
cbETH
0.00
10.00
0.00%
9.00%
0.02%
Asset
Total Borrow
Total Supply
Utilization
USDT0
-26% from 2.03M USDT0 to 1.50M USDT0
-25% from 2.25M USDT0 to 1.68M USDT0
-1% from 90.33% to 89.57%
USDC
+3% from 9.34M USDC to 9.62M USDC
+3% from 10.44M USDC to 10.74M USDC
+0% from 89.44% to 89.62%
WETH
+9% from 6.95K WETH to 7.54K WETH
+9% from 7.74K WETH to 8.41K WETH
-0% from 89.75% to 89.62%
DAI
+73% from 271.10K DAI to 469.75K DAI +57% from 328.68K DAI to 517.54K DAI +10% from 82.48% to 90.77%
USDT
+86% from 255.27K USDT to 474.15K USDT +64% from 321.26K USDT to 528.10K USDT +13% from 79.46% to 89.78%
wrsETH
-6% from 3.90 wrsETH to 3.65 wrsETH
-8% from 38.72 wrsETH to 35.67 wrsETH
+2% from 10.08% to 10.24%
OP
-32% from 179.75K OP to 121.63K OP
-3% from 2.55M OP to 2.47M OP
-30% from 7.06% to 4.92%
VELO
+7% from 2.72M VELO to 2.92M VELO
-2% from 43.42M VELO to 42.77M VELO
+9% from 6.27% to 6.82%
wstETH
-22% from 68.88 wstETH to 53.96 wstETH
-13% from 1.05K wstETH to 908.89 wstETH
-10% from 6.57% to 5.94%
rETH
+13% from 5.76 rETH to 6.49 rETH
+4% from 115.66 rETH to 120.56 rETH
+8% from 4.98% to 5.38%
WBTC
0% from 0.00 WBTC to 0.00 WBTC
0% from 0.07 WBTC to 0.07 WBTC
+0% from 4.32% to 4.32%
weETH
+2% from 21.70 weETH to 22.24 weETH
+0% from 1.20K weETH to 1.20K weETH
+2% from 1.81% to 1.85%
cbETH
0% from 0.00 cbETH to 0.00 cbETH
0% from 0.90 cbETH to 0.90 cbETH
0% from 0.02% to 0.02%
USDT supply increased 64% from 321.26K to 528.10K USDT
USDT borrows increased 86% from 255.27K to 474.15K USDT
DAI supply increased 57% from 328.68K to 517.54K DAI
DAI borrows increased 73% from 271.10K to 469.75K DAI
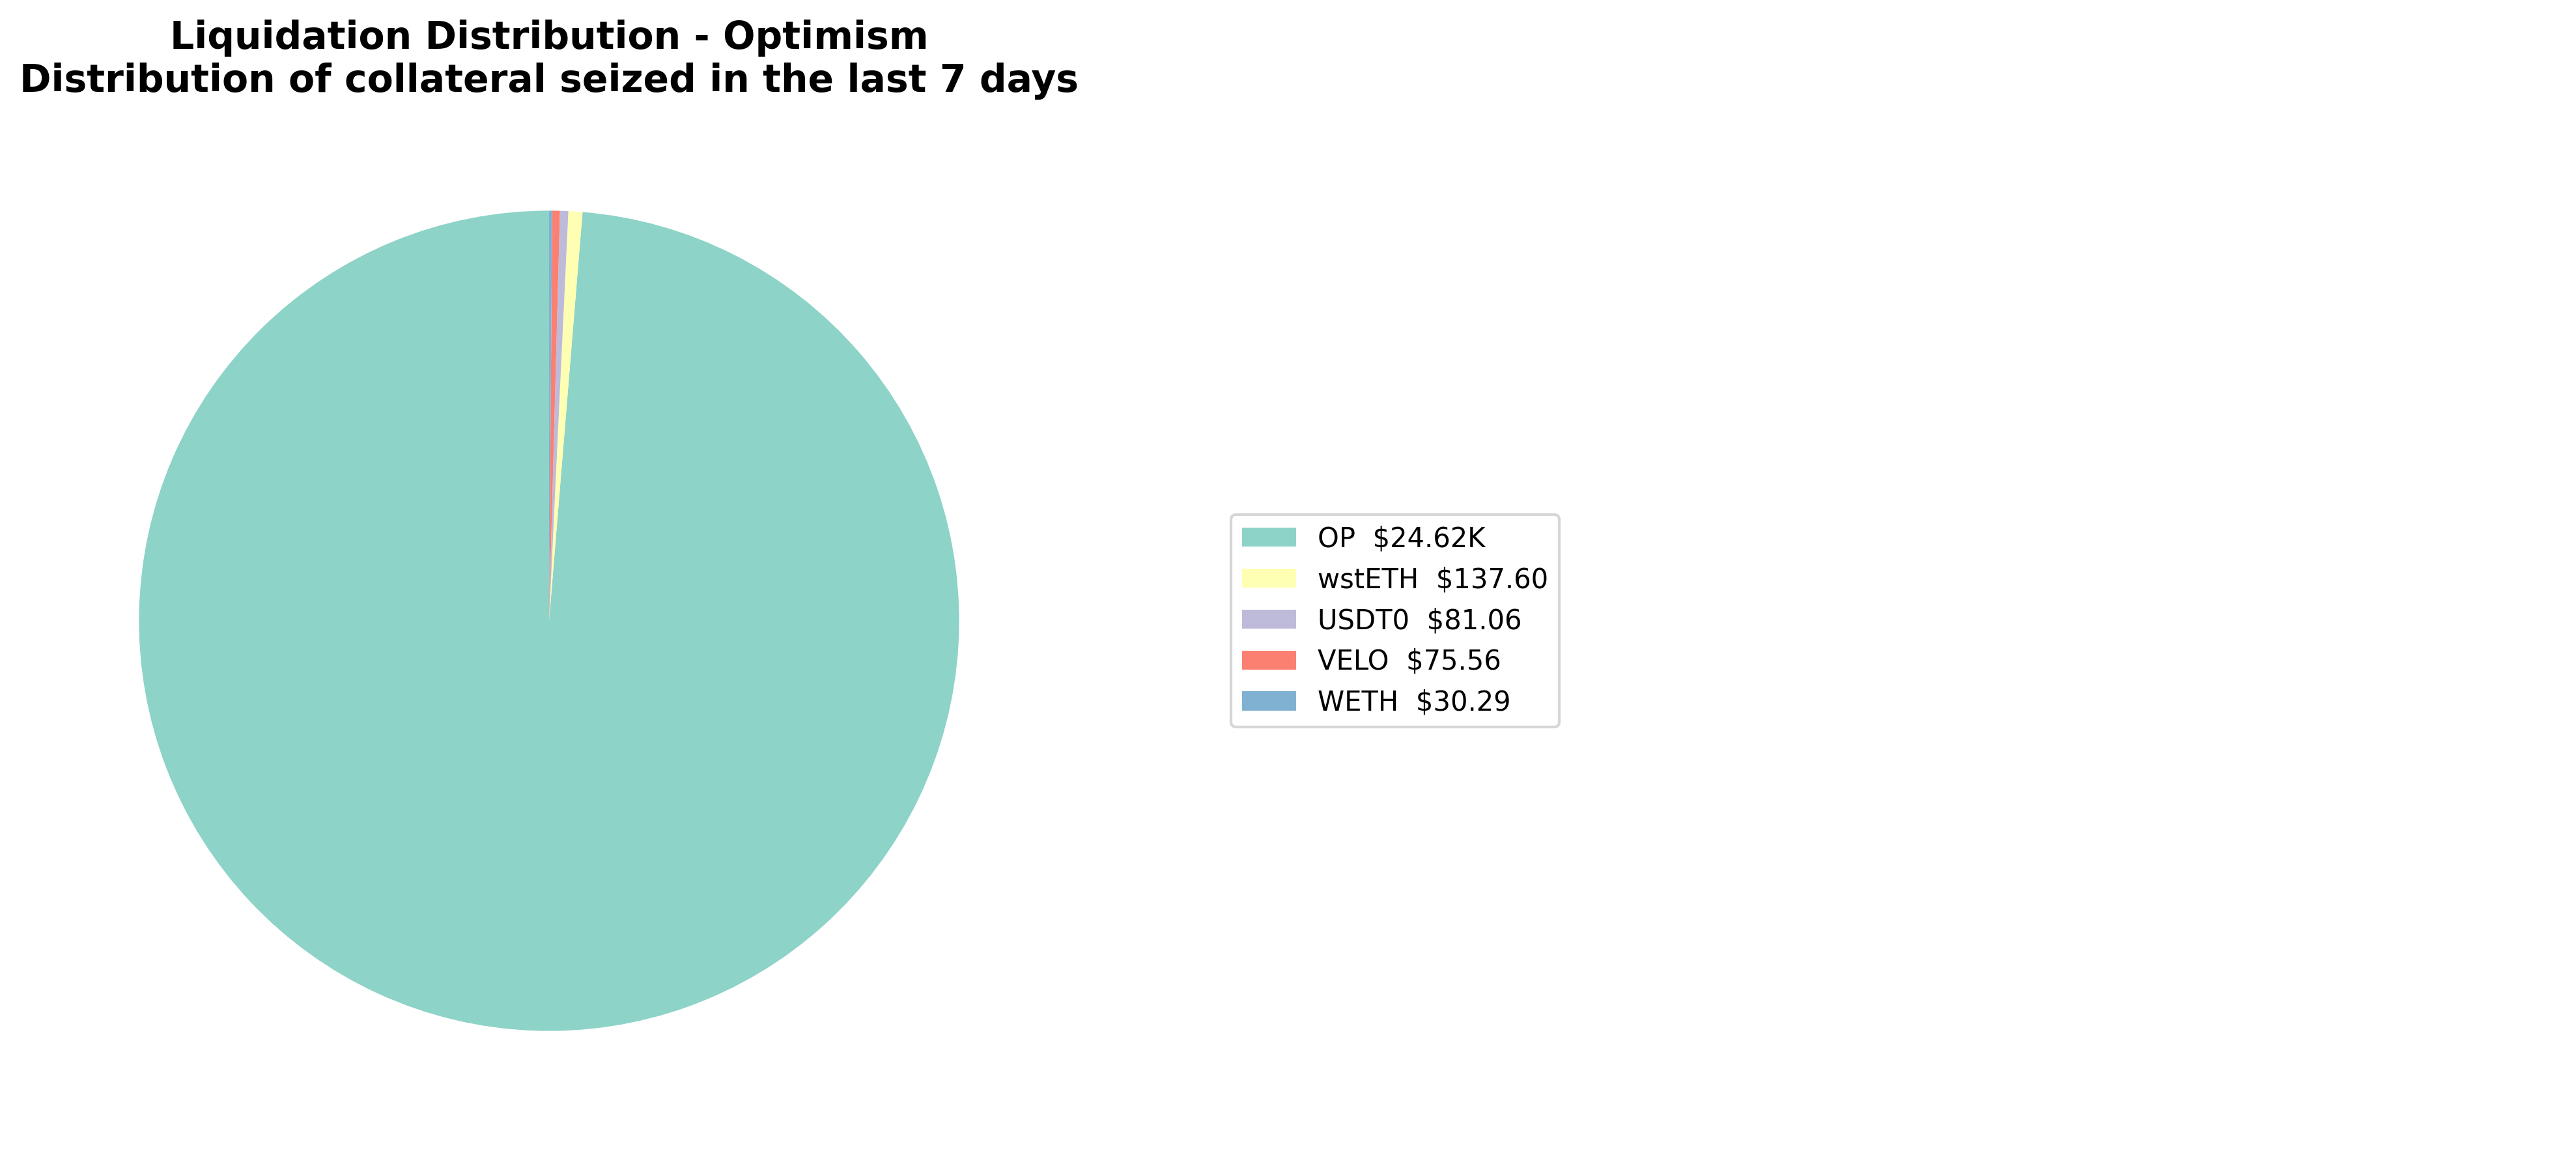
Total liquidations: 9Total Collateral Seized (USD): $24,941.26Total Debt Repaid (USD): $22,673.87Total Liquidation Bonus (USD): $2,267.39Total Liquidator Bonus (USD): $1,587.17Total Protocol Bonus (USD): $680.22
Asset
Total Seized (Tokens)
Total Seized (USD)
Debt Repaid (USD)
Liquidation Bonus (USD)
Liquidator Bonus (USD)
Protocol Bonus (USD)
Liquidation Count
OP
38,562.253490
$24,616.75
$22,378.86
$2,237.89
$1,566.52
$671.37
2
wstETH
0.032129
$137.60
$125.09
$12.51
$8.76
$3.75
1
USDT0
81.090790
$81.06
$73.69
$7.37
$5.16
$2.21
4
VELO
1,649.840000
$75.56
$68.69
$6.87
$4.81
$2.06
1
WETH
0.008661
$30.29
$27.53
$2.75
$1.93
$0.83
1
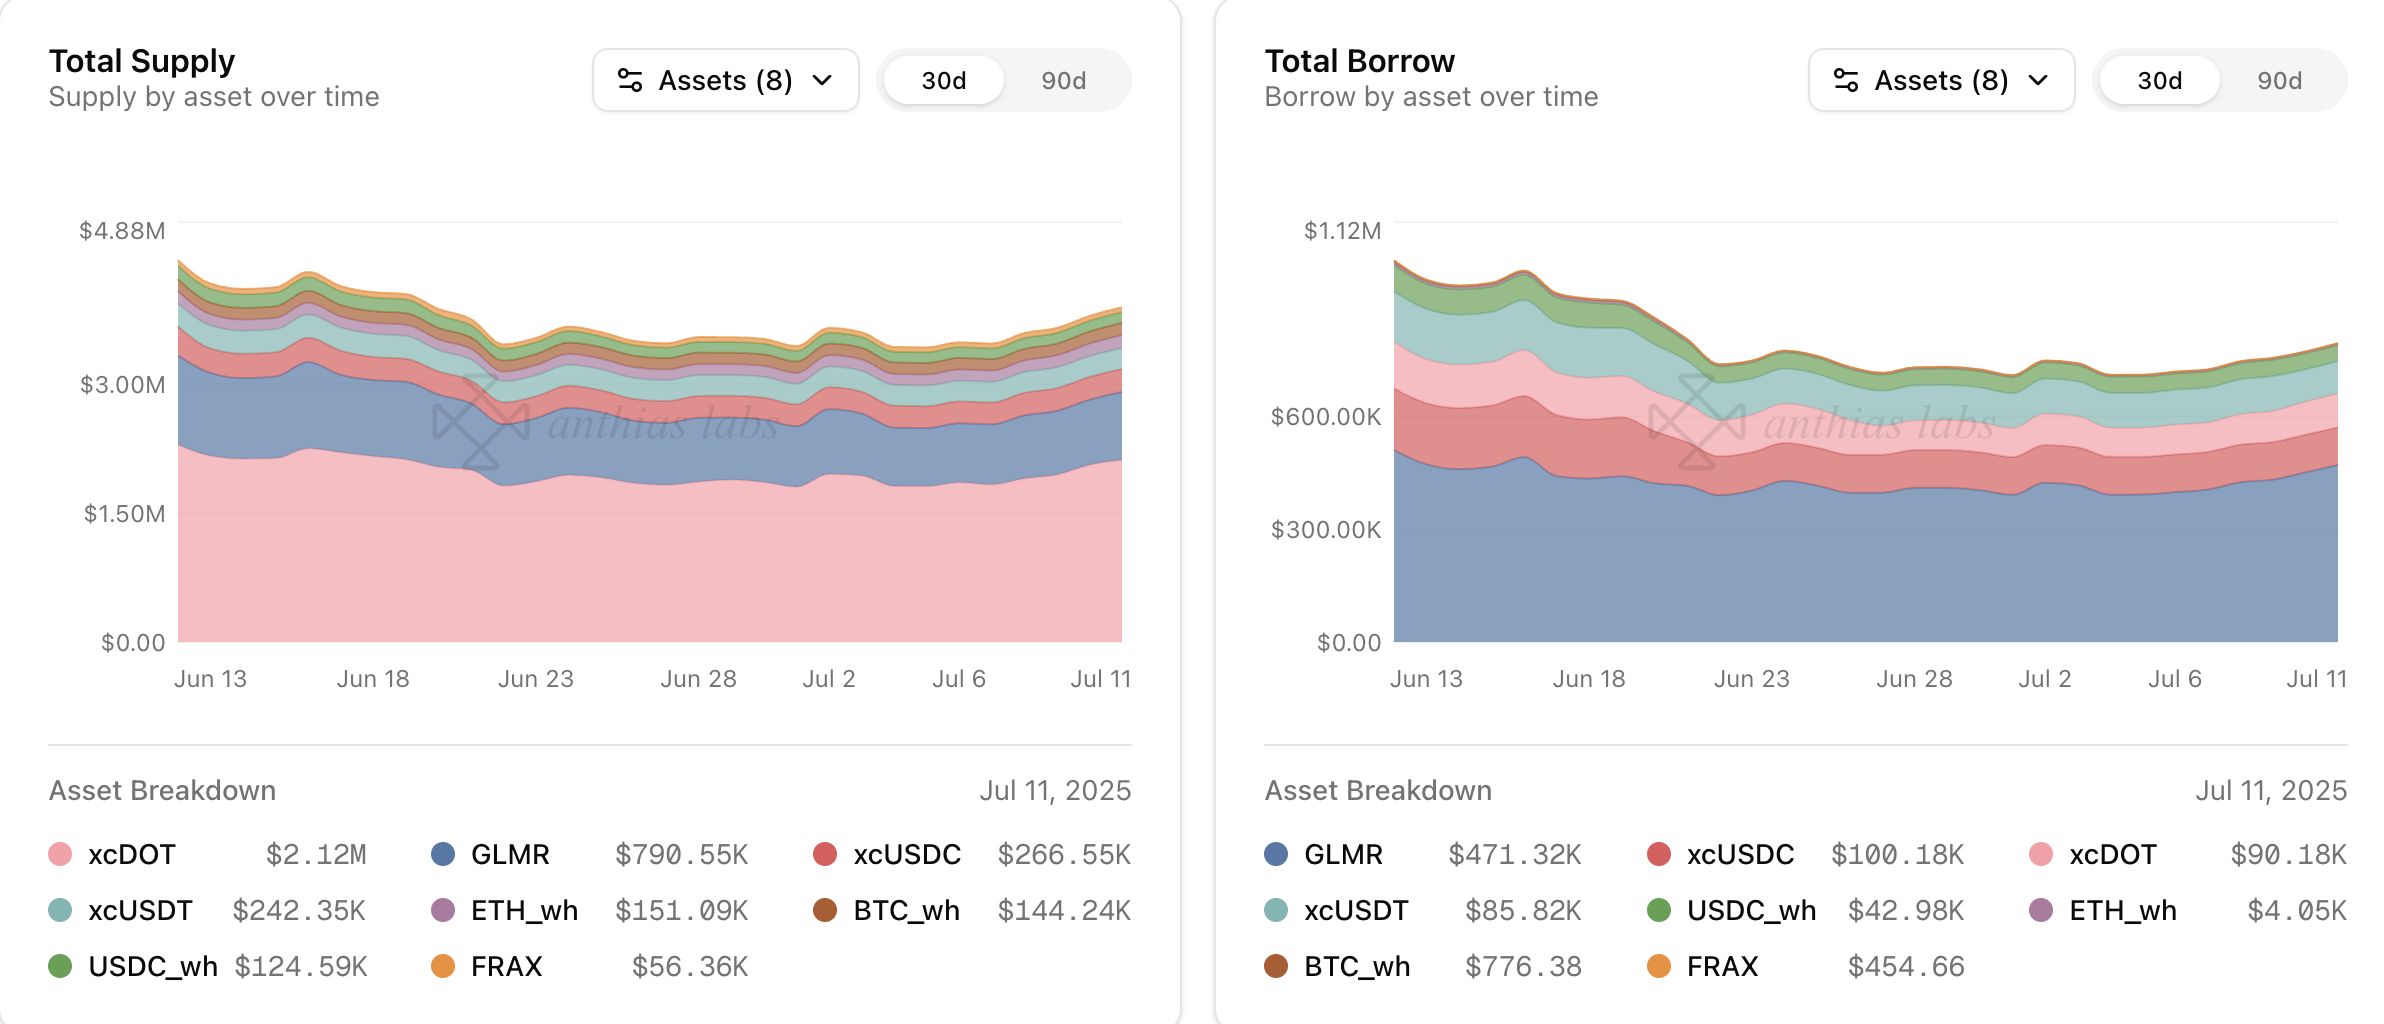
Asset
Current Borrow Cap
Average Borrow Cap Usage (Past Week)
Average Utilization
GLMR
0.10
6617.67M%
60.91%
xcUSDC
0.10
98.37M%
59.13%
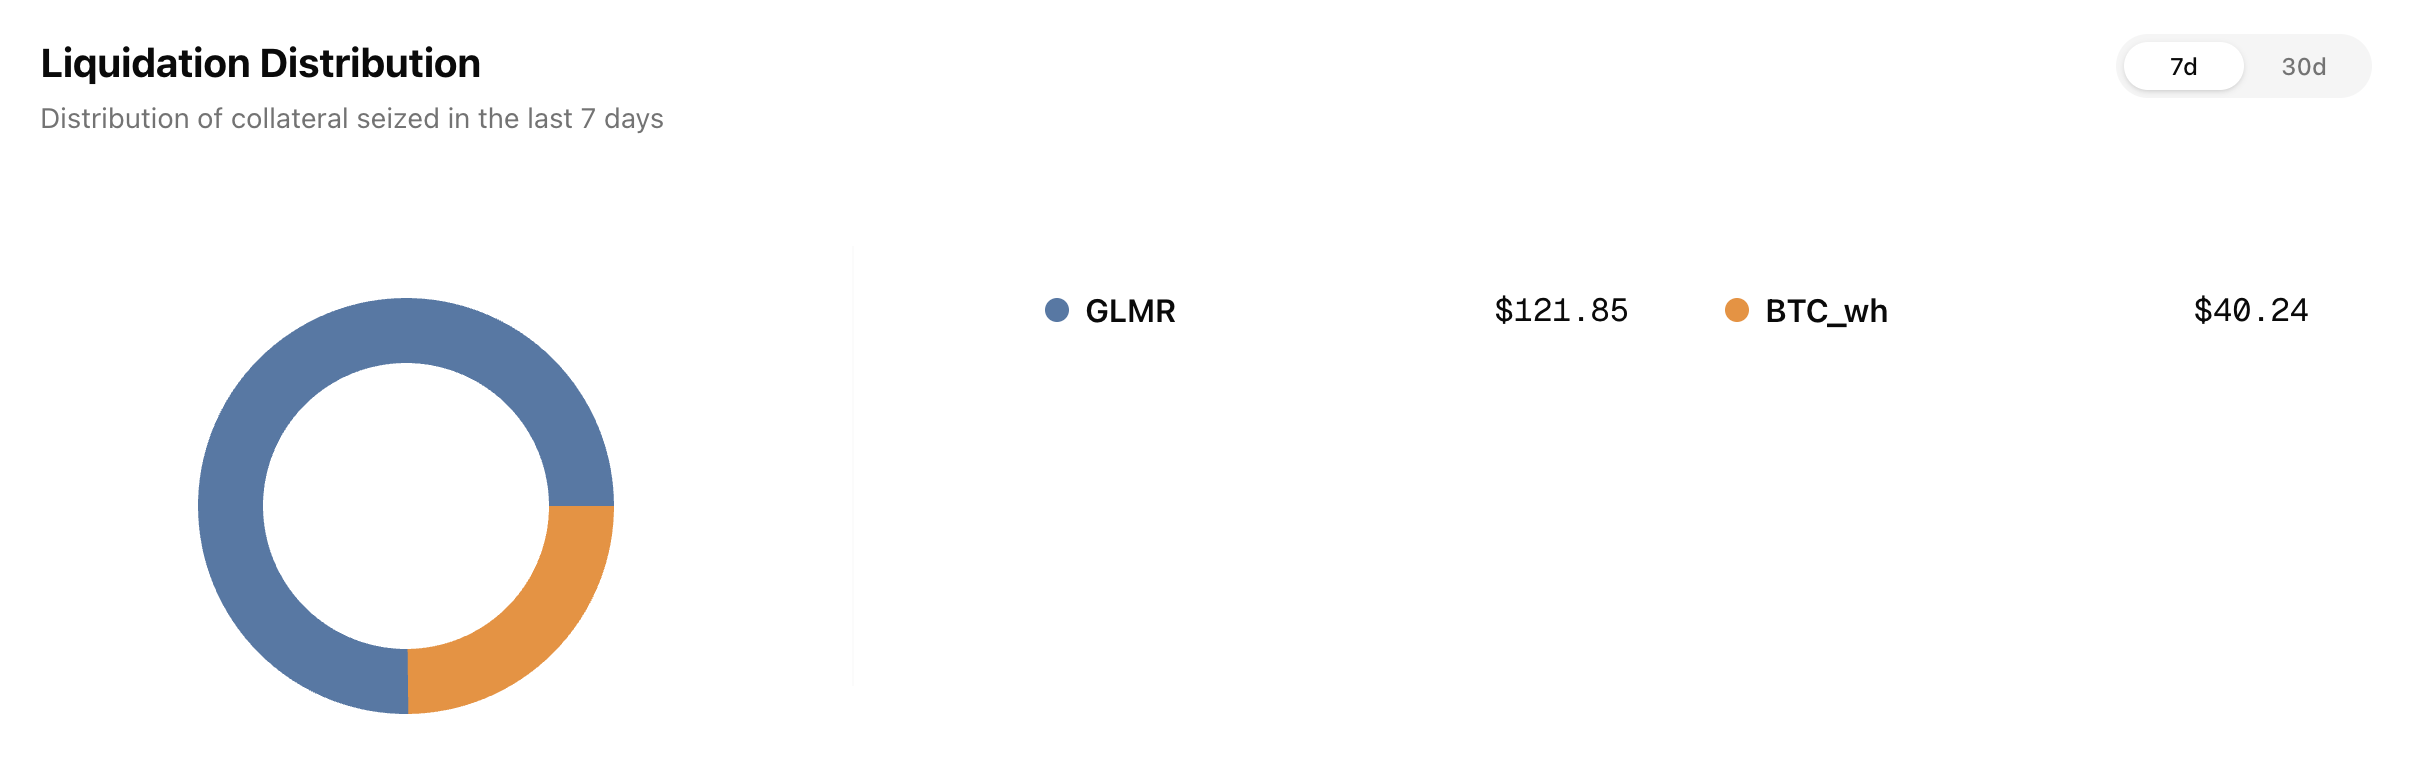
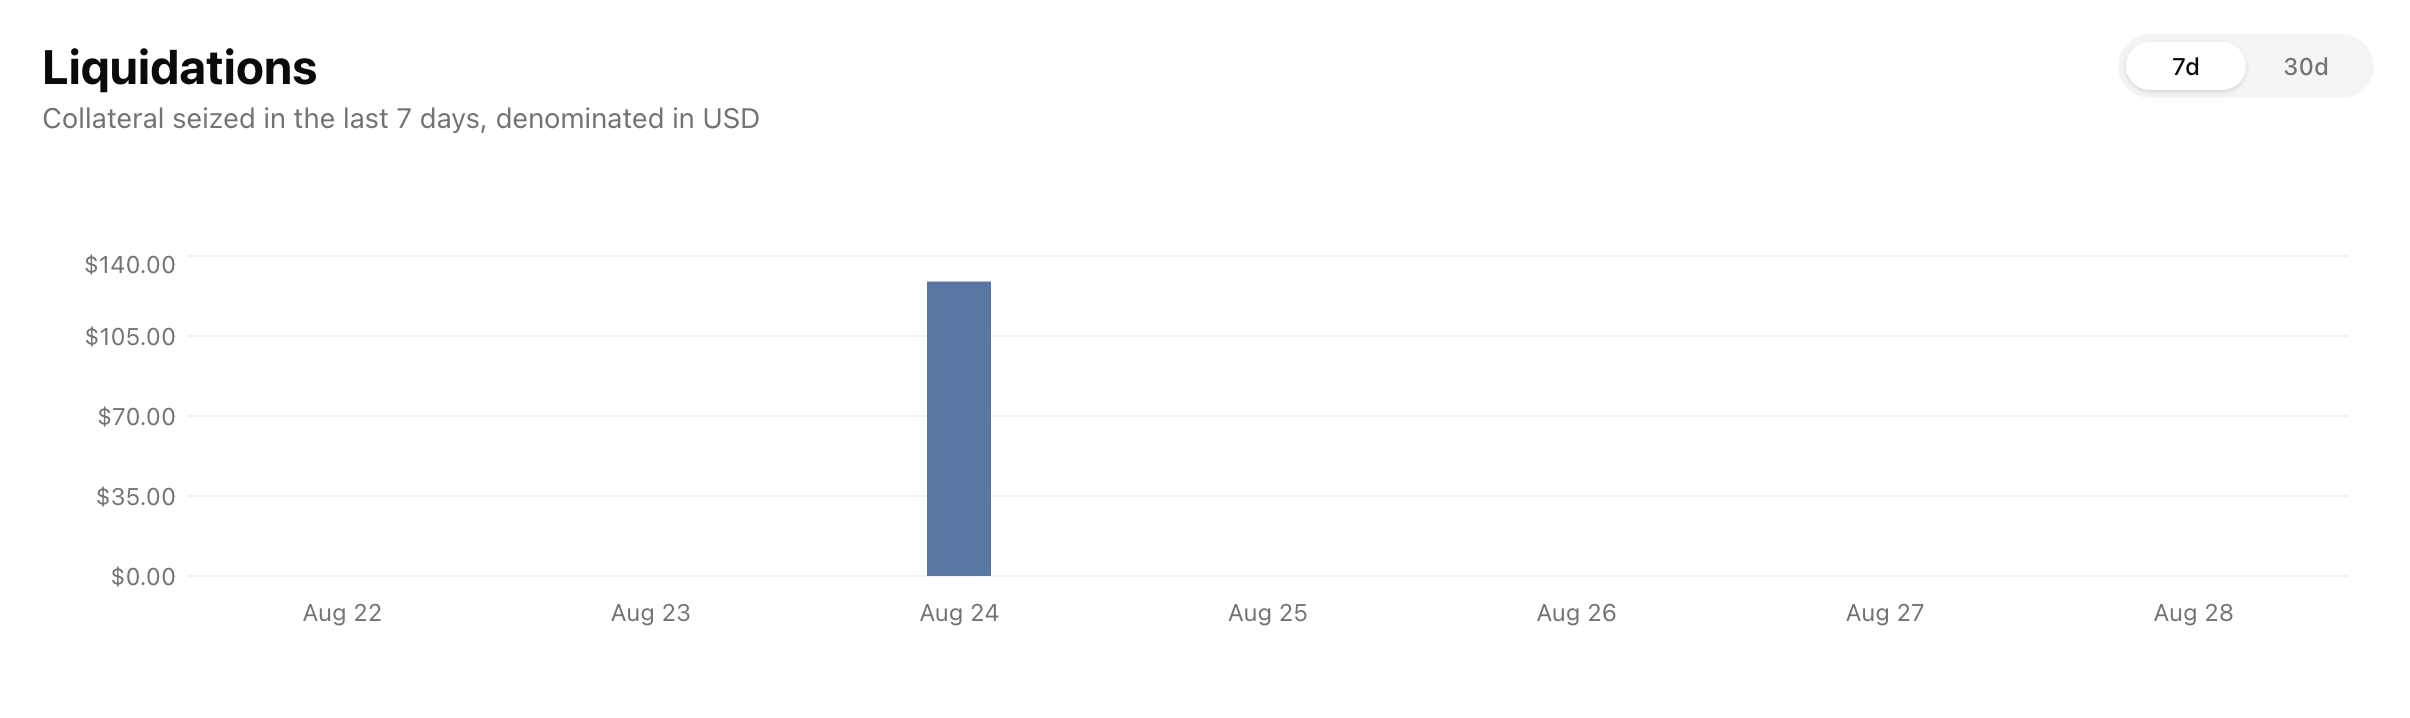
xcUSDT
0.10
83.36M%
45.55%
USDC_wh
0.10
41.54M%
33.58%
BTC_wh
0.10
99.99%
8.22%
xcDOT
0.10
23.15M%
100%
ETH_wh
0.10
1.27K%
2.68%
FRAX
0.10
450.32K%
44.90%
Asset
Total Borrow
Total Supply
Utilization
GLMR
+1% from 6.60M GLMR to 6.64M GLMR
-3% from 11.02M GLMR to 10.69M GLMR
+4% from 59.88% to 62.10%
xcUSDC
-1% from 98.76K xcUSDC to 98.03K xcUSDC
-2% from 169.18K xcUSDC to 165.44K xcUSDC
+2% from 58.38% to 59.26%
xcUSDT
-1% from 83.47K xcUSDT to 82.72K xcUSDT
-1% from 184.01K xcUSDT to 181.58K xcUSDT
+0% from 45.36% to 45.55%
USDC_wh
+0% from 41.48K USDC_wh to 41.61K USDC_wh
-3% from 123.96K USDC_wh to 120.22K USDC_wh
+3% from 33.46% to 34.61%
BTC_wh
+0% from 0.10 BTC_wh to 0.10 BTC_wh
-3% from 1.24 BTC_wh to 1.20 BTC_wh
+3% from 8.09% to 8.32%
xcDOT
+0% from 23.14K xcDOT to 23.15K xcDOT
+0% from 536.55K xcDOT to 536.56K xcDOT
+0% from 100% to 100%
ETH_wh
-1% from 1.27 ETH_wh to 1.26 ETH_wh
-2% from 47.96 ETH_wh to 47.01 ETH_wh
+1% from 2.65% to 2.69%
FRAX
-0% from 451.37 FRAX to 450.12 FRAX
+0% from 40.77K FRAX to 40.77K FRAX
-0% from 44.91% to 44.90%
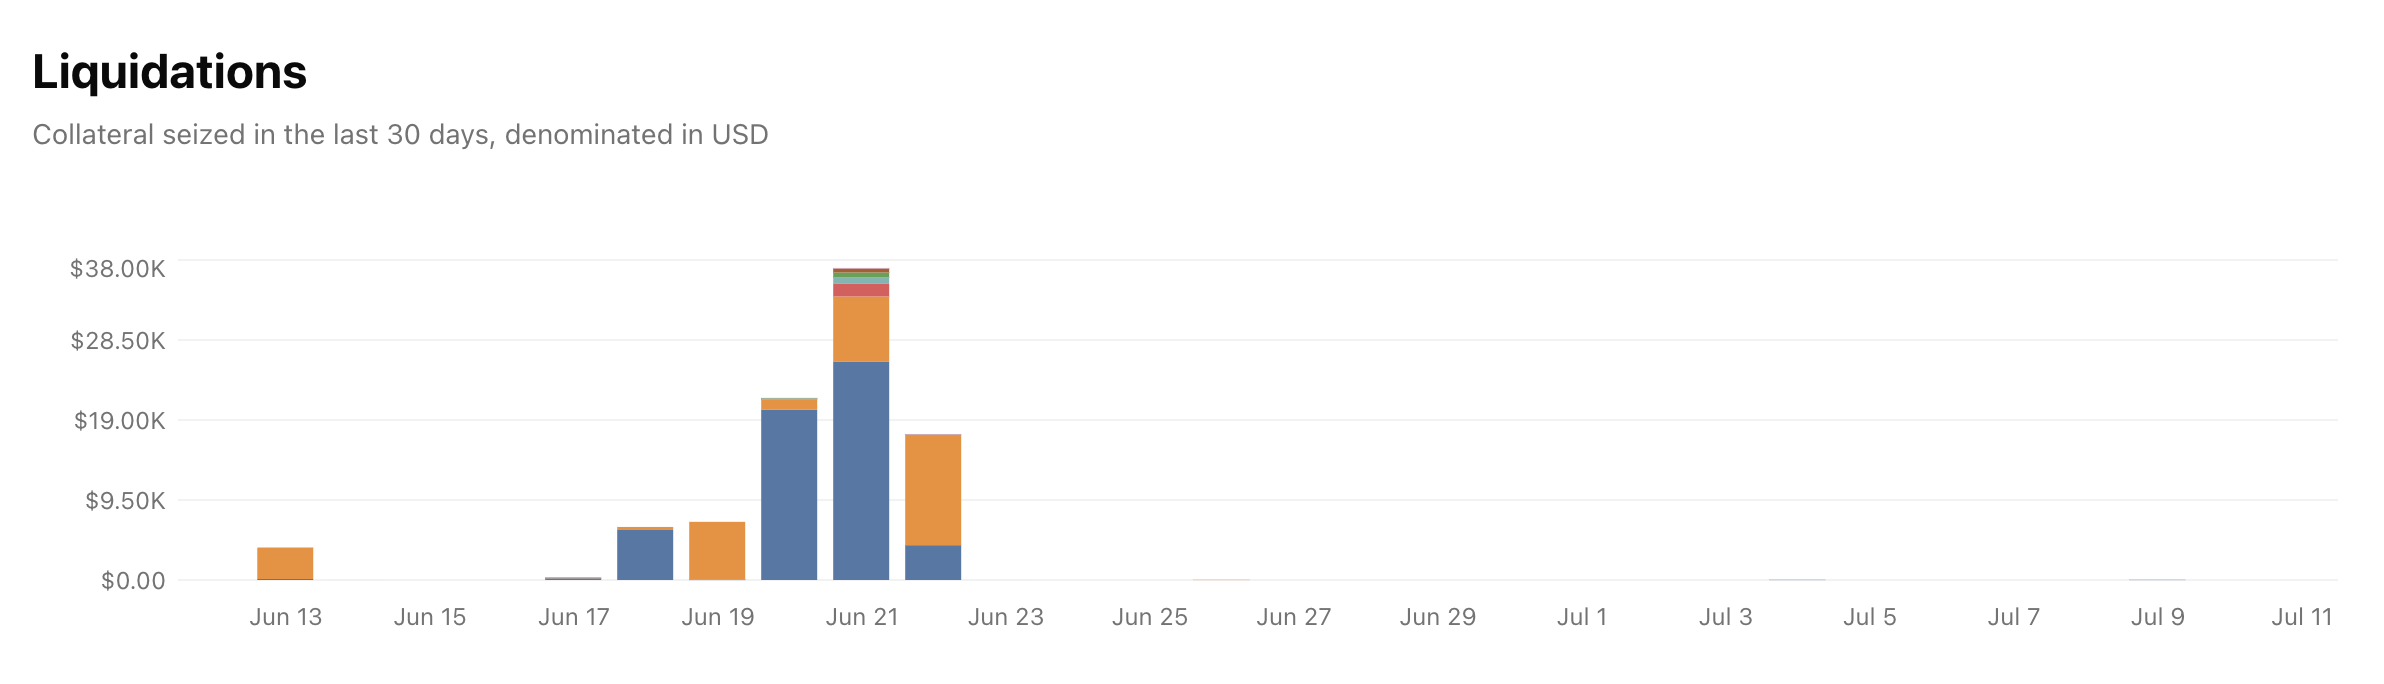
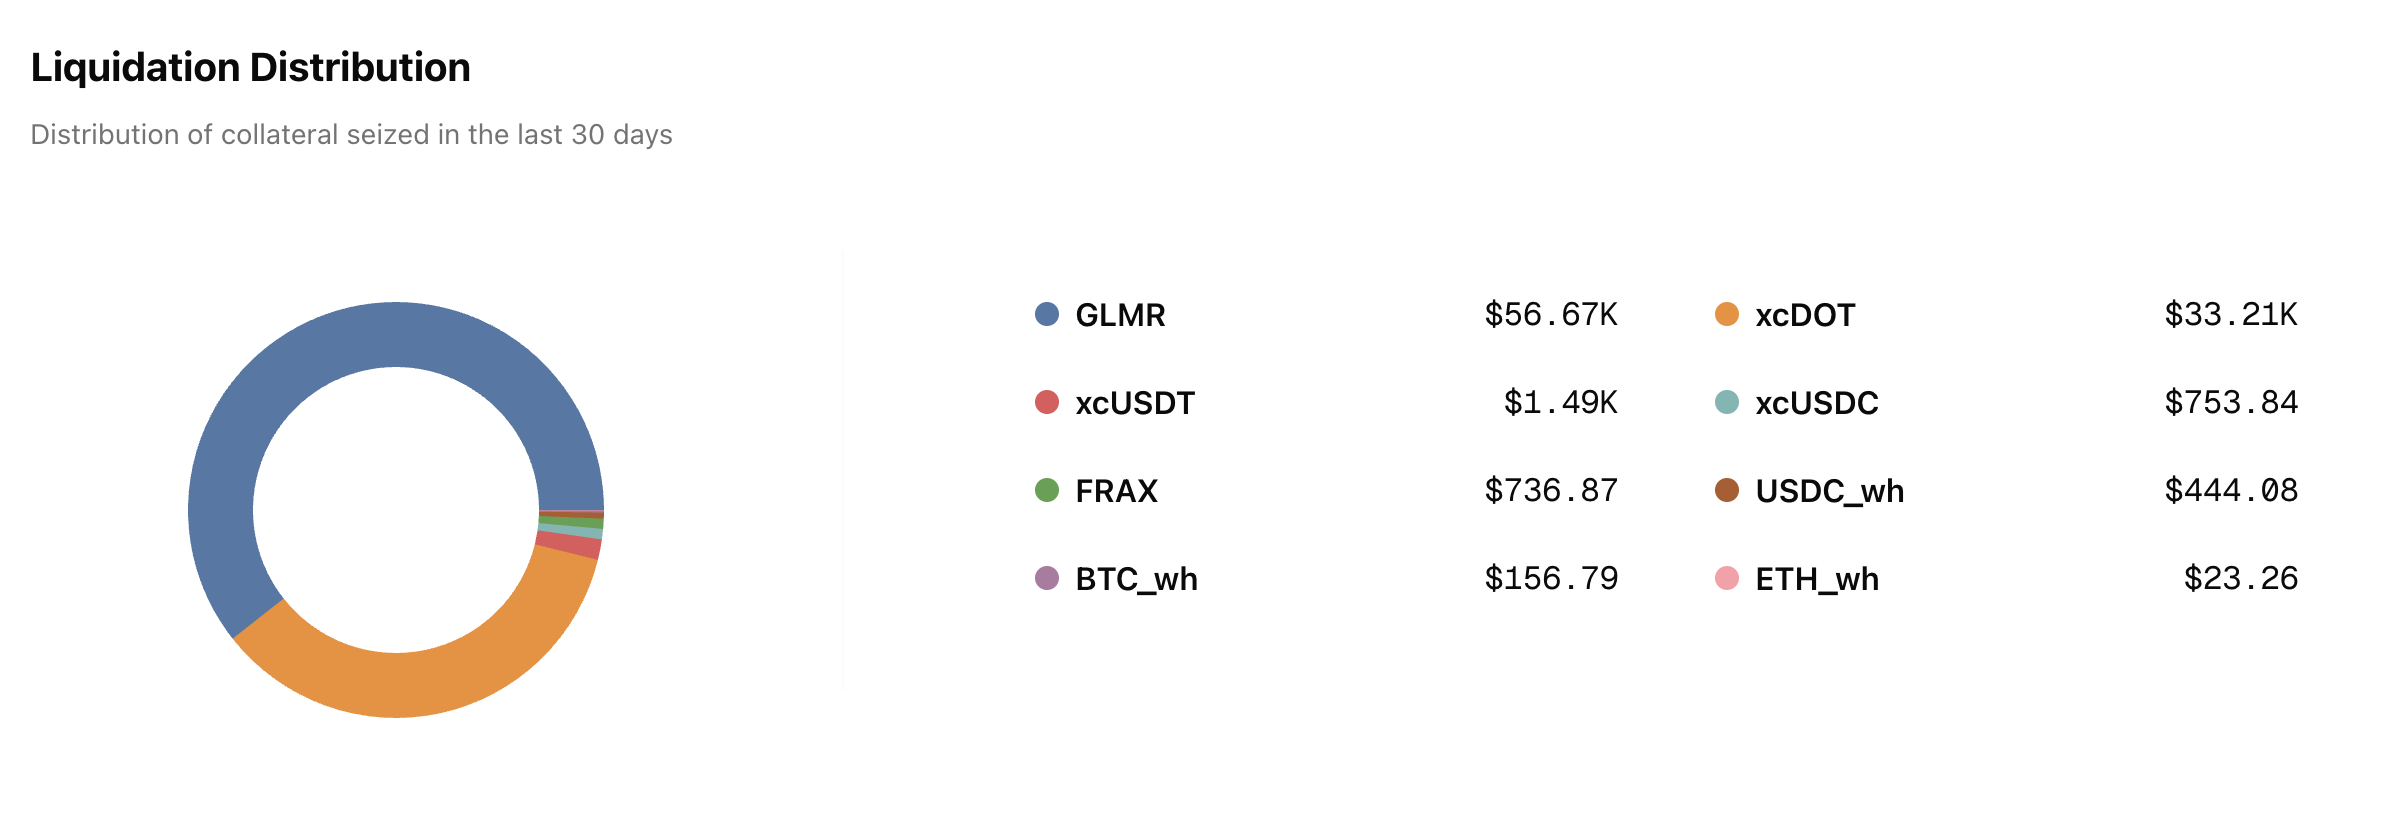
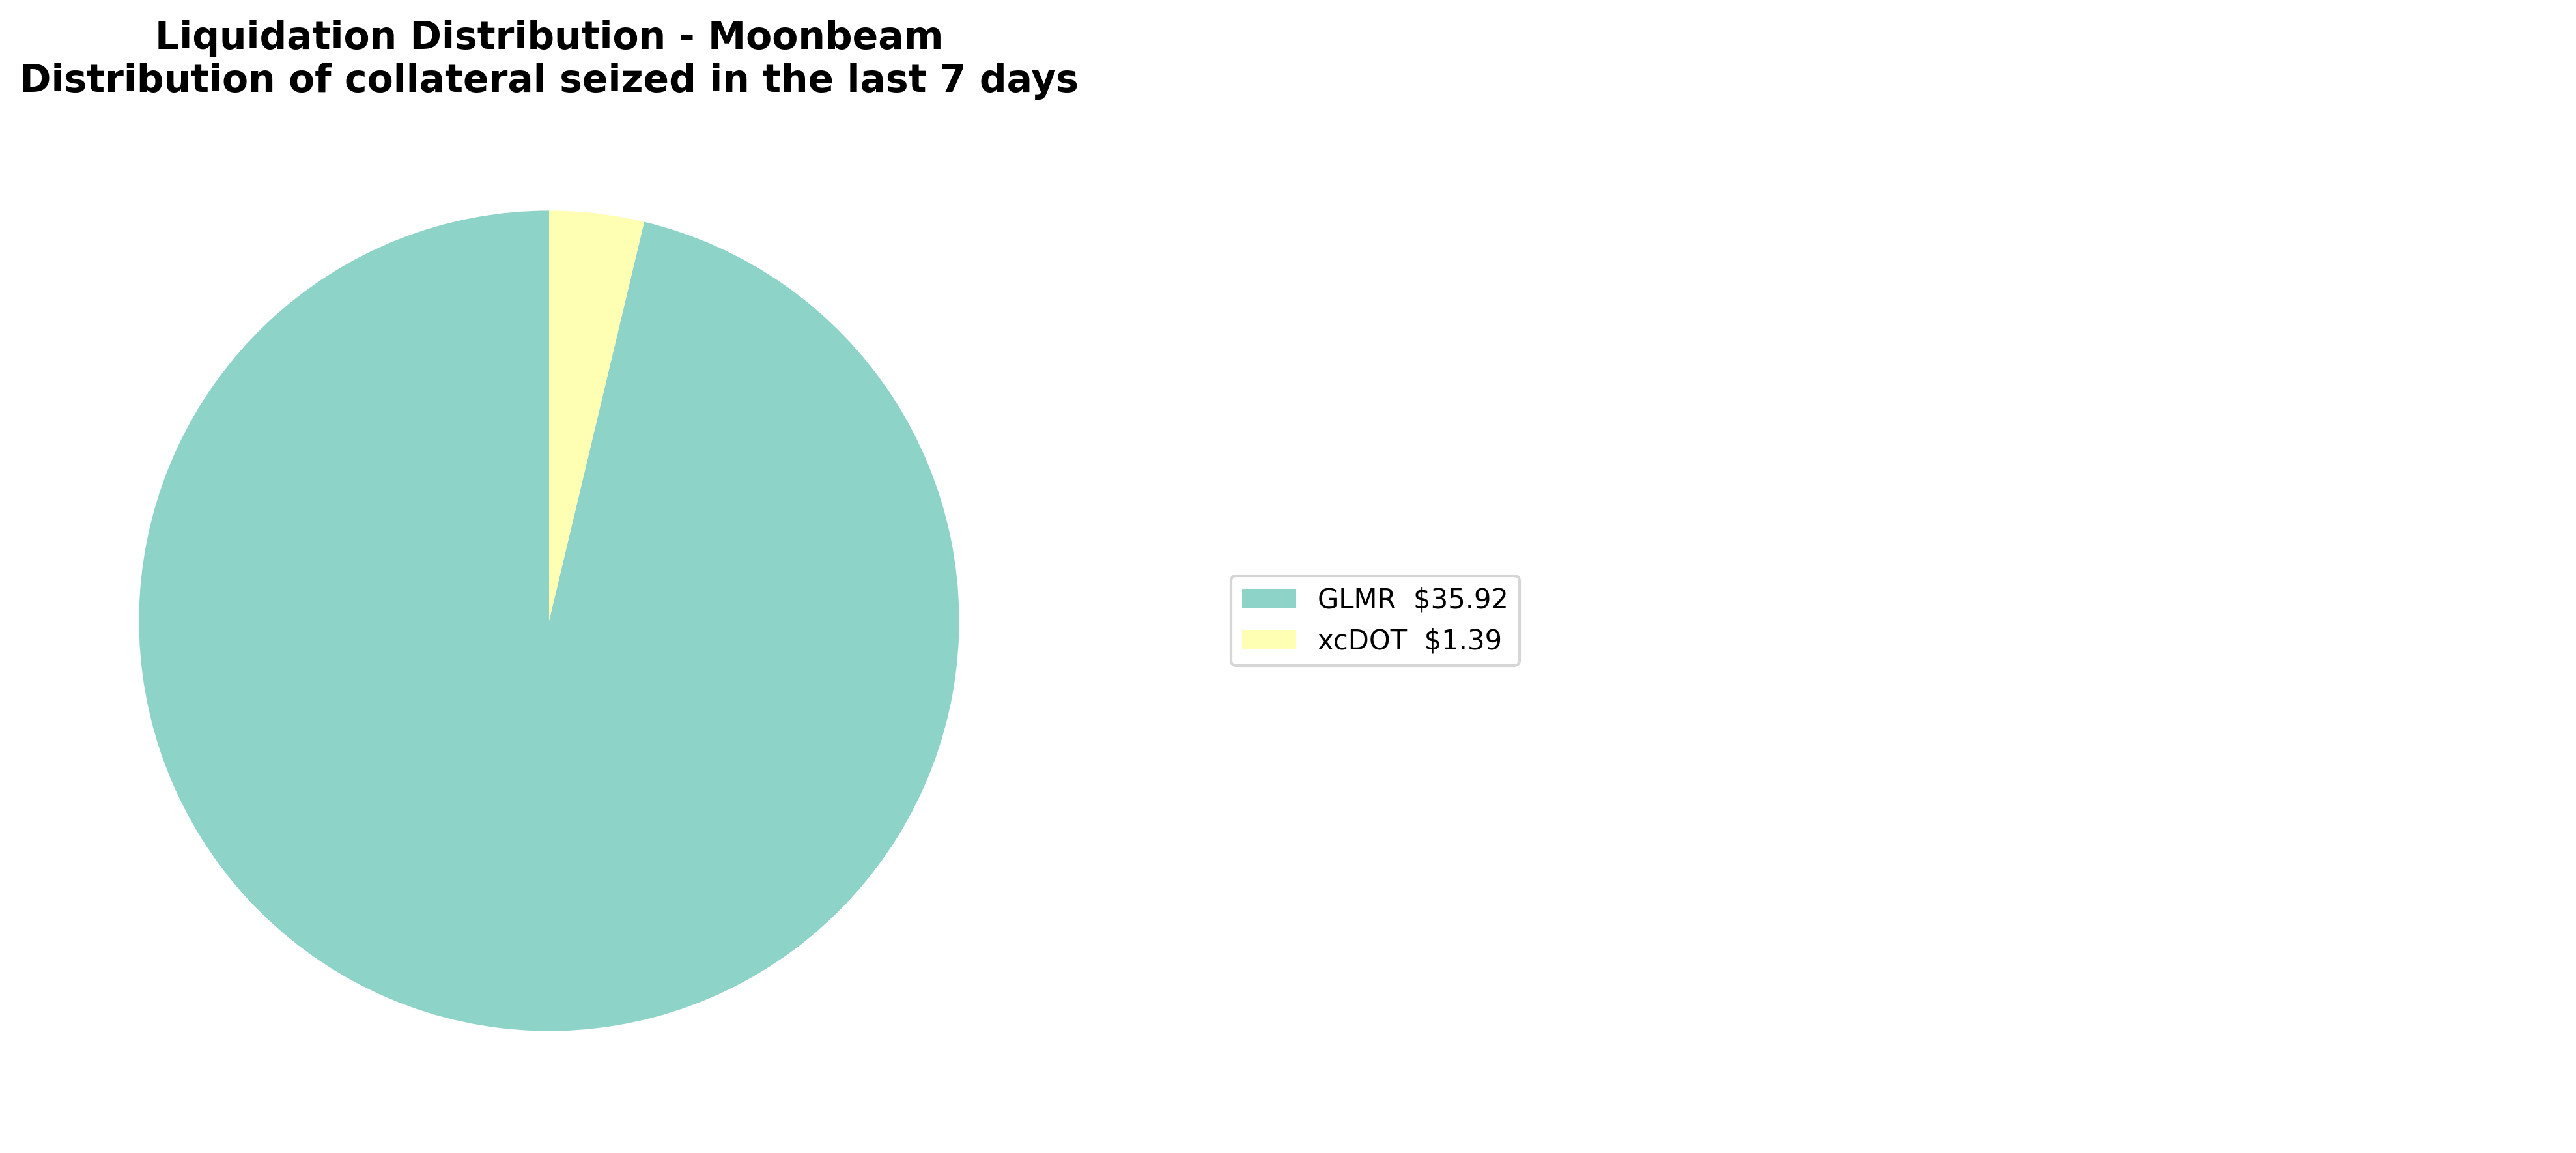
Total liquidations: 10Total Collateral Seized (USD): $37.31Total Debt Repaid (USD): $33.92Total Liquidation Bonus (USD): $3.39Total Liquidator Bonus (USD): $2.37Total Protocol Bonus (USD): $1.02
Asset
Total Seized (Tokens)
Total Seized (USD)
Debt Repaid (USD)
Liquidation Bonus (USD)
Liquidator Bonus (USD)
Protocol Bonus (USD)
Liquidation Count
GLMR
529.010160
$35.92
$32.65
$3.27
$2.29
$0.98
8
xcDOT
0.384574
$1.39
$1.26
$0.13
$0.09
$0.04
2
Asset
Current Borrow Cap
Average Borrow Cap Usage (Past Week)
Average Utilization
xcKSM
0.10
6.80M%
42.95%
FRAX
0.10
64.36M%
19.58%
MOVR
0.10
3.80M%
2.54%
Asset
Total Borrow
Total Supply
Utilization
xcKSM
+0% from 6.80K xcKSM to 6.81K xcKSM
+0% from 15.83K xcKSM to 15.90K xcKSM
-0% from 42.96% to 42.81%
FRAX
+0% from 64.35K FRAX to 64.36K FRAX
+0% from 328.76K FRAX to 328.76K FRAX
+0% from 19.57% to 19.58%
MOVR
+0% from 3.80K MOVR to 3.80K MOVR
-0% from 149.55K MOVR to 149.34K MOVR
+0% from 2.54% to 2.55%
No liquidation events on Moonriver this week.
1 Like
Anthias Labs would like to provide an update on market performance over the past week for Core markets on Base, OP mainnet, Moonbeam, and Moonriver. Data from 8/8/25 to 8/14/25. More information can be found on our monitoring dashboard .
Asset
Current Borrow Cap
Current Supply Cap
Average Borrow Cap Usage (Past Week)
Average Supply Cap Usage (Past Week)
Average Utilization
USDC
184.00M
200.00M
27.86%
28.47%
90.05%
USDS
690.00K
750.00K
2.02%
2.15%
86.94%
WETH
64.00K
96.00K
21.22%
16.28%
86.85%
EURC
21.00M
21.90M
12.61%
14.94%
80.96%
DAI
300.00K
400.00K
6.73%
7.86%
64.26%
AERO
25.00M
70.00M
31.77%
38.98%
29.09%
WELL
75.00M
220.00M
42.60%
73.83%
19.72%
VIRTUAL
2.30M
4.50M
14.75%
39.99%
18.76%
tBTC
36.00
90.00
3.84%
8.39%
18.20%
LBTC
38.00
95.00
17.66%
42.64%
16.44%
USDbC
1.00
1.00
150.65K%
1.01M%
14.99%
cbXRP
1.60M
3.00M
10.06%
44.58%
12.03%
cbBTC
640.00
1.50K
11.04%
42.67%
10.93%
wstETH
4.80K
14.40K
3.57%
34.37%
3.46%
cbETH
6.40K
16.00K
1.29%
15.18%
3.39%
MORPHO
1.00M
6.00M
18.83%
92.44%
3.26%
rETH
900.00
2.60K
3.32%
45.33%
2.59%
weETH
700.00
4.00K
5.02%
69.17%
1.27%
wrsETH
430.00
1.00K
0.34%
13.52%
1.16%
Asset
Total Borrow
Total Supply
Utilization
USDC
-26% from 74.29M USDC to 54.74M USDC
-26% from 82.37M USDC to 60.78M USDC
-0% from 90.19% to 90.06%
USDS
+3% from 13.42K USDS to 13.78K USDS
+1% from 16.00K USDS to 16.11K USDS
+2% from 83.83% to 85.58%
WETH
-16% from 20.82K WETH to 17.56K WETH
-12% from 23.39K WETH to 20.58K WETH
-4% from 89.02% to 85.34%
EURC
-16% from 2.90M EURC to 2.44M EURC
-13% from 3.41M EURC to 2.99M EURC
-4% from 84.82% to 81.61%
DAI
+4% from 19.63K DAI to 20.33K DAI
-1% from 31.47K DAI to 31.25K DAI
+4% from 62.37% to 65.06%
AERO
-8% from 8.48M AERO to 7.84M AERO
+3% from 26.95M AERO to 27.82M AERO
-11% from 31.47% to 28.16%
WELL
+7% from 33.69M WELL to 36.07M WELL
-9% from 167.53M WELL to 152.06M WELL
+18% from 20.11% to 23.72%
VIRTUAL
-22% from 503.87K VIRTUAL to 391.33K VIRTUAL
-12% from 2.02M VIRTUAL to 1.77M VIRTUAL
-11% from 24.88% to 22.06%
tBTC
-57% from 3.26 tBTC to 1.41 tBTC -18% from 9.42 tBTC to 7.71 tBTC
-47% from 34.60% to 18.29%
LBTC
-26% from 11.43 LBTC to 8.43 LBTC
-5% from 45.77 LBTC to 43.51 LBTC
-22% from 24.96% to 19.37%
USDbC
-2% from 1.51K USDbC to 1.48K USDbC
-0% from 10.07K USDbC to 10.04K USDbC
-2% from 14.99% to 14.75%
cbXRP
+22% from 204.24K cbXRP to 249.04K cbXRP
+13% from 1.33M cbXRP to 1.50M cbXRP
+8% from 15.31% to 16.56%
cbBTC
-13% from 133.35 cbBTC to 116.08 cbBTC
-11% from 743.09 cbBTC to 662.48 cbBTC
-2% from 17.95% to 17.52%
wstETH
+36% from 113.57 wstETH to 154.09 wstETH
-15% from 5.28K wstETH to 4.51K wstETH
+59% from 2.15% to 3.42%
cbETH
+144% from 66.40 cbETH to 161.96 cbETH +3% from 2.45K cbETH to 2.53K cbETH
+136% from 2.71% to 6.40%
MORPHO
-5% from 675.85K MORPHO to 642.31K MORPHO
+0% from 6.00M MORPHO to 6.00M MORPHO
-5% from 11.26% to 10.70%
rETH
+68% from 25.68 rETH to 43.20 rETH -17% from 1.27K rETH to 1.05K rETH
+104% from 2.02% to 4.12%
weETH
-21% from 41.18 weETH to 32.49 weETH
+11% from 2.72K weETH to 3.03K weETH
-29% from 1.52% to 1.07%
wrsETH
+1400% from 0.21 wrsETH to 3.20 wrsETH -19% from 150.14 wrsETH to 121.39 wrsETH
+1756% from 0.14% to 2.64%
cbETH borrows increased 144% from 66.40 to 161.96 cbETH
rETH borrows increased 68% from 25.68 to 43.20 rETH
wstETH borrows increased 36% from 113.57 to 154.09 wstETH
USDC supply decreased 26% from 82.37M to 60.78M USDC
USDC borrows decreased 26% from 74.29M to 54.74M USDC
tBTC borrows decreased 57% from 3.26 to 1.41 tBTC
Total liquidations: 193Total Collateral Seized (USD): $2,595,641.02Total Debt Repaid (USD): $2,359,673.66Total Liquidation Bonus (USD): $235,967.37Total Liquidator Bonus (USD): $165,177.16Total Protocol Bonus (USD): $70,790.21
Asset
Total Seized (Tokens)
Total Seized (USD)
Debt Repaid (USD)
Liquidation Bonus (USD)
Liquidator Bonus (USD)
Protocol Bonus (USD)
Liquidation Count
cbBTC
14.814149
$1,828,965.90
$1,662,696.27
$166,269.63
$116,388.74
$49,880.89
20
WETH
70.426896
$284,529.81
$258,663.46
$25,866.35
$18,106.44
$7,759.90
33
USDC
248,788.028277
$248,746.39
$226,133.09
$22,613.31
$15,829.32
$6,783.99
82
AERO
84,482.485680
$97,965.97
$89,059.97
$8,906.00
$6,234.20
$2,671.80
11
weETH
13.699377
$69,854.92
$63,504.47
$6,350.45
$4,445.31
$1,905.13
9
wstETH
6.975516
$33,361.17
$30,328.34
$3,032.83
$2,122.98
$909.85
6
cbETH
3.534058
$16,856.81
$15,324.37
$1,532.44
$1,072.71
$459.73
3
VIRTUAL
5,680.103320
$7,562.63
$6,875.11
$687.51
$481.26
$206.25
8
WELL
212,067.678300
$6,712.31
$6,102.10
$610.21
$427.15
$183.06
6
cbXRP
229.895360
$708.71
$644.28
$64.43
$45.10
$19.33
3
USDS
244.905800
$244.87
$222.61
$22.26
$15.58
$6.68
4
tBTC
0.000797
$94.02
$85.47
$8.55
$5.98
$2.56
2
USDbC
23.539480
$23.54
$21.40
$2.14
$1.50
$0.64
4
rETH
0.002283
$12.21
$11.10
$1.11
$0.78
$0.33
1
DAI
1.762860
$1.76
$1.60
$0.16
$0.11
$0.05
1
Asset
Current Borrow Cap
Current Supply Cap
Average Borrow Cap Usage (Past Week)
Average Supply Cap Usage (Past Week)
Average Utilization
WETH
30.00K
32.00K
19.06%
19.95%
89.62%
USDC
34.00M
36.40M
15.80%
16.51%
89.31%
DAI
4.50M
4.80M
6.67%
7.03%
86.88%
USDT
18.40M
22.60M
1.86%
1.80%
80.82%
USDT0
8.00M
10.00M
8.92%
9.33%
73.30%
wrsETH
160.00
400.00
1.66%
7.06%
9.02%
OP
650.00K
5.60M
22.07%
42.19%
6.07%
VELO
20.00M
68.00M
12.49%
64.63%
5.69%
WBTC
0.00
0.00
0.00%
0.00%
4.33%
wstETH
1.50K
5.00K
2.17%
16.32%
3.91%
rETH
340.00
750.00
1.05%
14.65%
3.21%
weETH
220.00
1.20K
4.36%
99.37%
0.80%
cbETH
0.00
10.00
0.00%
8.95%
0.02%
Asset
Total Borrow
Total Supply
Utilization
WETH
+8% from 7.54K WETH to 8.17K WETH
+8% from 8.41K WETH to 9.09K WETH
+0% from 89.62% to 89.85%
USDC
-15% from 10.94M USDC to 9.33M USDC
-16% from 12.33M USDC to 10.37M USDC
+1% from 88.68% to 89.90%
DAI
-23% from 469.75K DAI to 363.71K DAI
-24% from 517.54K DAI to 393.79K DAI
+2% from 90.77% to 92.36%
USDT
+17% from 474.15K USDT to 555.61K USDT
+17% from 528.12K USDT to 617.77K USDT
+0% from 89.78% to 89.94%
USDT0
-32% from 1.50M USDT0 to 1.02M USDT0
-23% from 1.68M USDT0 to 1.30M USDT0
-12% from 89.57% to 78.47%
wrsETH
-82% from 3.65 wrsETH to 0.65 wrsETH -33% from 35.67 wrsETH to 23.88 wrsETH
-74% from 10.24% to 2.71%
OP
+129% from 121.64K OP to 278.46K OP -6% from 2.47M OP to 2.32M OP
+144% from 4.92% to 12.00%
VELO
-17% from 2.93M VELO to 2.42M VELO
+8% from 42.69M VELO to 46.15M VELO
-23% from 6.86% to 5.25%
WBTC
0% from 0.00 WBTC to 0.00 WBTC
0% from 0.07 WBTC to 0.07 WBTC
+0% from 4.32% to 4.33%
wstETH
-30% from 53.96 wstETH to 37.72 wstETH
-3% from 908.67 wstETH to 880.24 wstETH
-28% from 5.94% to 4.28%
rETH
-91% from 6.49 rETH to 0.61 rETH +13% from 120.56 rETH to 136.58 rETH
-92% from 5.38% to 0.45%
weETH
-48% from 22.24 weETH to 11.59 weETH -0% from 1.20K weETH to 1.20K weETH
-48% from 1.85% to 0.97%
cbETH
0% from 0.00 cbETH to 0.00 cbETH
-3% from 0.90 cbETH to 0.88 cbETH
+3% from 0.02% to 0.02%
OP borrows increased 129% from 121.64K to 278.46K OP
wstETH borrows decreased 30% from 53.96 to 37.72 wstETH
USDT0 borrows decreased 32% from 1.50M to 1.02M USDT0
Total liquidations: 28Total Collateral Seized (USD): $2,290.98Total Debt Repaid (USD): $2,082.71Total Liquidation Bonus (USD): $208.27Total Liquidator Bonus (USD): $145.79Total Protocol Bonus (USD): $62.48
Asset
Total Seized (Tokens)
Total Seized (USD)
Debt Repaid (USD)
Liquidation Bonus (USD)
Liquidator Bonus (USD)
Protocol Bonus (USD)
Liquidation Count
USDC
2,269.586430
$2,269.25
$2,062.96
$206.30
$144.41
$61.89
26
OP
25.229800
$19.31
$17.56
$1.76
$1.23
$0.53
1
DAI
2.413290
$2.41
$2.19
$0.22
$0.15
$0.07
1
Asset
Current Borrow Cap
Average Borrow Cap Usage (Past Week)
Average Utilization
GLMR
0.10
6668.17M%
63.17%
xcUSDC
0.10
95.82M%
58.39%
xcUSDT
0.10
81.49M%
44.86%
USDC_wh
0.10
41.73M%
34.77%
BTC_wh
0.10
100.09%
8.39%
xcDOT
0.10
23.16M%
4.32%
ETH_wh
0.10
1.26K%
2.67%
FRAX
0.10
448.32K%
1.10%
Asset
Total Borrow
Total Supply
Utilization
GLMR
+1% from 6.64M GLMR to 6.69M GLMR
-1% from 10.69M GLMR to 10.57M GLMR
+2% from 62.10% to 63.36%
xcUSDC
-7% from 98.03K xcUSDC to 91.09K xcUSDC
-1% from 165.44K xcUSDC to 163.29K xcUSDC
-6% from 59.26% to 55.79%
xcUSDT
-2% from 82.72K xcUSDT to 81.37K xcUSDT
+0% from 181.58K xcUSDT to 181.69K xcUSDT
-2% from 45.55% to 44.78%
USDC_wh
+1% from 41.61K USDC_wh to 41.88K USDC_wh
-0% from 120.22K USDC_wh to 119.86K USDC_wh
+1% from 34.61% to 34.94%
BTC_wh
+0% from 0.10 BTC_wh to 0.10 BTC_wh
-1% from 1.20 BTC_wh to 1.19 BTC_wh
+1% from 8.32% to 8.41%
xcDOT
+0% from 23.15K xcDOT to 23.16K xcDOT
+0% from 536.56K xcDOT to 536.57K xcDOT
+0% from 100% to 100%
ETH_wh
-2% from 1.26 ETH_wh to 1.24 ETH_wh
-0% from 47.01 ETH_wh to 46.99 ETH_wh
-2% from 2.69% to 2.65%
FRAX
-0% from 450.12 FRAX to 447.94 FRAX
+0% from 40.77K FRAX to 40.77K FRAX
-0% from 44.90% to 44.90%
Total liquidations: 7Total Collateral Seized (USD): $162.09Total Debt Repaid (USD): $147.35Total Liquidation Bonus (USD): $14.74Total Liquidator Bonus (USD): $10.31Total Protocol Bonus (USD): $4.42
Asset
Total Seized (Tokens)
Total Seized (USD)
Debt Repaid (USD)
Liquidation Bonus (USD)
Liquidator Bonus (USD)
Protocol Bonus (USD)
Liquidation Count
GLMR
1,620.618800
$121.85
$110.78
$11.08
$7.75
$3.32
6
BTC_wh
0.000345
$40.24
$36.58
$3.66
$2.56
$1.10
1
Asset
Current Borrow Cap
Average Borrow Cap Usage (Past Week)
Average Utilization
xcKSM
0.10
6.61M%
42.62%
FRAX
0.10
64.38M%
19.57%
MOVR
0.10
3.70M%
2.49%
Asset
Total Borrow
Total Supply
Utilization
xcKSM
-3% from 6.81K xcKSM to 6.58K xcKSM
-5% from 15.90K xcKSM to 15.13K xcKSM
+2% from 42.81% to 43.50%
FRAX
+0% from 64.36K FRAX to 64.39K FRAX
+0% from 328.76K FRAX to 329.00K FRAX
-0% from 19.58% to 19.57%
MOVR
-6% from 3.80K MOVR to 3.57K MOVR
-0% from 149.34K MOVR to 148.66K MOVR
-6% from 2.55% to 2.40%
No liquidation event on Moonriver this week.
1 Like
Dear Moonwell Team,
Thank you for your detailed explanation regarding the xcDOT market metrics. I understand that there is outstanding bad debt from the Nomad exploit in 2022, and how it affects the liquidity calculations.
However, I must respectfully point out that my assets are my own. I cannot accept being blocked from withdrawing my xcDOT due to losses that are unrelated to my account or actions. The fact that bad debt exists in the system does not mean I should be prevented from accessing my own funds.
I kindly request that the team find a solution that allows me to withdraw my xcDOT without being unfairly affected by historic bad debt. Please advise on how this can be resolved promptly. I can provide wallet address and screenshots if needed.
I appreciate your understanding and look forward to your support in resolving this matter.
Best regards,
2 Likes
Anthias Labs would like to provide an update on market performance over the past week for Core markets on Base, OP mainnet, Moonbeam, and Moonriver. Data from 8/15/25 to 8/21/25. More information can be found on our monitoring dashboard .
Asset
Current Borrow Cap
Current Supply Cap
Average Borrow Cap Usage (Past Week)
Average Supply Cap Usage (Past Week)
Average Utilization
USDS
690.00K
750.00K
2.33%
2.41%
89.19%
USDC
184.00M
200.00M
28.93%
29.90%
89.09%
WETH
64.00K
96.00K
29.20%
22.43%
86.70%
EURC
21.00M
21.90M
11.37%
14.82%
74.01%
DAI
300.00K
400.00K
6.78%
7.77%
65.43%
AERO
25.00M
70.00M
31.42%
38.81%
28.92%
VIRTUAL
2.30M
4.50M
27.72%
50.00%
28.52%
WELL
75.00M
220.00M
52.64%
72.96%
24.60%
LBTC
38.00
95.00
23.00%
46.00%
20.00%
tBTC
36.00
90.00
4.70%
9.73%
19.31%
cbBTC
640.00
1.50K
18.98%
44.22%
18.31%
cbXRP
1.60M
3.00M
15.96%
53.93%
15.80%
USDbC
1.00
1.00
148.17K%
1.00M%
14.76%
MORPHO
1.00M
6.00M
62.67%
99.74%
10.47%
wstETH
4.80K
14.40K
3.85%
31.11%
4.12%
cbETH
6.40K
16.00K
1.36%
15.21%
3.55%
rETH
900.00
2.60K
3.32%
40.23%
2.86%
wrsETH
430.00
1.00K
0.75%
12.12%
2.64%
weETH
700.00
4.00K
4.67%
75.66%
1.08%
Asset
Total Borrow
Total Supply
Utilization
USDS
+34% from 13.78K USDS to 18.54K USDS
+27% from 16.11K USDS to 20.40K USDS
+6% from 85.58% to 90.89%
USDC
-0% from 56.26M USDC to 56.11M USDC
+0% from 62.56M USDC to 62.73M USDC
-1% from 89.94% to 89.44%
WETH
+6% from 17.59K WETH to 18.65K WETH
+5% from 20.61K WETH to 21.56K WETH
+1% from 85.35% to 86.51%
EURC
-5% from 2.44M EURC to 2.31M EURC
-1% from 2.99M EURC to 2.97M EURC
-4% from 81.58% to 77.97%
DAI
-0% from 20.34K DAI to 20.33K DAI
-1% from 31.25K DAI to 31.01K DAI
+1% from 65.06% to 65.57%
AERO
+25% from 7.89M AERO to 9.88M AERO
-3% from 27.52M AERO to 26.82M AERO
+29% from 28.65% to 36.82%
VIRTUAL
+137% from 399.94K VIRTUAL to 949.70K VIRTUAL +41% from 1.77M VIRTUAL to 2.50M VIRTUAL +68% from 22.60% to 37.94%
WELL
+17% from 36.07M WELL to 42.08M WELL
+7% from 151.92M WELL to 162.02M WELL
+9% from 23.74% to 25.97%
LBTC
+9% from 8.43 LBTC to 9.20 LBTC
-0% from 43.51 LBTC to 43.51 LBTC
+9% from 19.37% to 21.15%
tBTC
+26% from 1.41 tBTC to 1.78 tBTC
+18% from 8.07 tBTC to 9.50 tBTC
+7% from 17.48% to 18.77%
cbBTC
+12% from 115.59 cbBTC to 128.96 cbBTC
+0% from 663.02 cbBTC to 663.53 cbBTC
+11% from 17.43% to 19.43%
cbXRP
+4% from 248.86K cbXRP to 258.77K cbXRP
+11% from 1.51M cbXRP to 1.67M cbXRP
-6% from 16.49% to 15.46%
USDbC
+0% from 1.48K USDbC to 1.48K USDbC
-0% from 10.04K USDbC to 10.03K USDbC
+0% from 14.75% to 14.77%
MORPHO
-5% from 644.74K MORPHO to 609.81K MORPHO
-1% from 6.00M MORPHO to 5.92M MORPHO
-4% from 10.74% to 10.30%
wstETH
+33% from 151.29 wstETH to 200.91 wstETH
-1% from 4.51K wstETH to 4.46K wstETH
+34% from 3.35% to 4.51%
cbETH
-54% from 162.06 cbETH to 74.23 cbETH -5% from 2.53K cbETH to 2.39K cbETH
-52% from 6.40% to 3.10%
rETH
-46% from 43.20 rETH to 23.18 rETH -0% from 1.05K rETH to 1.05K rETH
-46% from 4.12% to 2.21%
wrsETH
+0% from 3.20 wrsETH to 3.20 wrsETH
-1% from 121.39 wrsETH to 120.37 wrsETH
+1% from 2.64% to 2.66%
weETH
+3% from 32.49 weETH to 33.35 weETH
-0% from 3.03K weETH to 3.02K weETH
+3% from 1.07% to 1.10%
VIRTUAL supply increased 41% from 1.77M to 2.50M VIRTUAL
VIRTUAL borrows increased 137% from 399.94K to 949.70K VIRTUAL
AERO borrows increased 25% from 7.89M to 9.88M AERO
cbETH borrows decreased 54% from 162.06 to 74.23 cbETH
rETH borrows decreased 46% from 43.20 to 23.18 rETH
wstETH borrows increased 33% from 151.29 to 200.91 wstETH
Total liquidations: 109Total Collateral Seized (USD): $506,904.95Total Debt Repaid (USD): $460,822.68Total Liquidation Bonus (USD): $46,082.27Total Liquidator Bonus (USD): $32,257.59Total Protocol Bonus (USD): $13,824.68
Asset
Total Seized (Tokens)
Total Seized (USD)
Debt Repaid (USD)
Liquidation Bonus (USD)
Liquidator Bonus (USD)
Protocol Bonus (USD)
Liquidation Count
cbBTC
3.428561
$400,812.42
$364,374.92
$36,437.49
$25,506.24
$10,931.25
13
cbXRP
21,392.342711
$64,116.79
$58,287.99
$5,828.80
$4,080.16
$1,748.64
8
USDC
28,862.457738
$28,859.72
$26,236.11
$2,623.61
$1,836.53
$787.08
14
AERO
4,618.774800
$6,397.86
$5,816.24
$581.62
$407.14
$174.49
11
WELL
175,969.380000
$4,954.52
$4,504.11
$450.41
$315.29
$135.12
4
WETH
0.258181
$1,098.56
$998.69
$99.87
$69.91
$29.96
51
VIRTUAL
396.192100
$478.90
$435.36
$43.54
$30.48
$13.06
2
wstETH
0.029120
$157.47
$143.16
$14.32
$10.02
$4.29
1
EURC
16.033660
$18.72
$17.02
$1.70
$1.19
$0.51
2
USDbC
4.820630
$4.82
$4.38
$0.44
$0.31
$0.13
1
tBTC
0.000043
$4.80
$4.37
$0.44
$0.31
$0.13
1
cbETH
0.000076
$0.37
$0.34
$0.03
$0.02
$0.01
1
Asset
Current Borrow Cap
Current Supply Cap
Average Borrow Cap Usage (Past Week)
Average Supply Cap Usage (Past Week)
Average Utilization
WETH
30.00K
32.00K
21.78%
22.86%
89.37%
USDC
34.00M
36.40M
24.47%
25.60%
89.32%
USDT
18.40M
22.60M
2.70%
2.48%
88.37%
DAI
4.50M
4.80M
8.25%
8.71%
87.75%
USDT0
8.00M
10.00M
10.03%
9.76%
82.45%
OP
650.00K
5.60M
45.06%
40.65%
12.89%
VELO
20.00M
68.00M
11.99%
70.22%
5.03%
rETH
340.00
750.00
1.27%
13.81%
4.36%
WBTC
0.00
0.00
0.00%
0.00%
4.33%
wstETH
1.50K
5.00K
2.41%
16.99%
4.26%
wrsETH
160.00
400.00
0.40%
5.98%
2.69%
weETH
220.00
1.20K
5.89%
99.98%
1.08%
cbETH
0.00
10.00
0.00%
8.56%
0.02%
Asset
Total Borrow
Total Supply
Utilization
WETH
-8% from 8.17K WETH to 7.49K WETH
-7% from 9.10K WETH to 8.47K WETH
-2% from 89.85% to 88.39%
USDC
+5% from 9.33M USDC to 9.81M USDC
+6% from 10.38M USDC to 10.98M USDC
-1% from 89.90% to 89.36%
USDT
-32% from 550.63K USDT to 373.49K USDT
-28% from 617.80K USDT to 443.55K USDT
-6% from 89.13% to 84.21%
DAI
-30% from 363.74K DAI to 252.81K DAI
-23% from 396.02K DAI to 303.24K DAI
-9% from 91.85% to 83.37%
USDT0
-9% from 1.03M USDT0 to 935.61K USDT0
-13% from 1.30M USDT0 to 1.12M USDT0
+5% from 79.11% to 83.33%
OP
+6% from 278.46K OP to 296.07K OP
-7% from 2.32M OP to 2.16M OP
+14% from 12.00% to 13.72%
VELO
-11% from 2.42M VELO to 2.16M VELO
+8% from 46.24M VELO to 50.01M VELO
-18% from 5.24% to 4.31%
rETH
+1095% from 0.61 rETH to 7.32 rETH -26% from 136.58 rETH to 101.20 rETH
+1512% from 0.45% to 7.23%
WBTC
0% from 0.00 WBTC to 0.00 WBTC
0% from 0.07 WBTC to 0.07 WBTC
0% from 4.33% to 4.33%
wstETH
-7% from 37.72 wstETH to 35.15 wstETH
-5% from 881.17 wstETH to 841.05 wstETH
-2% from 4.28% to 4.18%
wrsETH
-2% from 0.65 wrsETH to 0.63 wrsETH
+1% from 23.88 wrsETH to 24.01 wrsETH
-3% from 2.71% to 2.64%
weETH
+13% from 11.59 weETH to 13.10 weETH
+0% from 1.20K weETH to 1.20K weETH
+13% from 0.97% to 1.09%
cbETH
0% from 0.00 cbETH to 0.00 cbETH
-7% from 0.88 cbETH to 0.81 cbETH
+8% from 0.02% to 0.02%
rETH borrows increased 1095% from 0.61 to 7.32 rETH
USDT supply decreased 28% from 617.80K to 443.55K USDT
USDT borrows decreased 32% from 550.63K to 373.49K USDT
Total liquidations: 4Total Collateral Seized (USD): $278.99Total Debt Repaid (USD): $253.63Total Liquidation Bonus (USD): $25.36Total Liquidator Bonus (USD): $17.75Total Protocol Bonus (USD): $7.61
Asset
Total Seized (Tokens)
Total Seized (USD)
Debt Repaid (USD)
Liquidation Bonus (USD)
Liquidator Bonus (USD)
Protocol Bonus (USD)
Liquidation Count
OP
246.885974
$180.44
$164.03
$16.40
$11.48
$4.92
2
VELO
1,444.350000
$72.90
$66.27
$6.63
$4.64
$1.99
1
WETH
0.005802
$25.66
$23.33
$2.33
$1.63
$0.70
1
Asset
Current Borrow Cap
Average Borrow Cap Usage (Past Week)
Average Utilization
GLMR
0.10
6725.29M%
63.09%
xcUSDC
0.10
91.15M%
55.84%
xcUSDT
0.10
81.30M%
44.97%
USDC_wh
0.10
42.05M%
35.98%
BTC_wh
0.10
100.10%
8.41%
xcDOT
0.10
23.16M%
100%
ETH_wh
0.10
1.24K%
2.63%
FRAX
0.10
447.94K%
44.90%
Asset
Total Borrow
Total Supply
Utilization
GLMR
+1% from 6.69M GLMR to 6.75M GLMR
+1% from 10.57M GLMR to 10.70M GLMR
-0% from 63.36% to 63.14%
xcUSDC
+0% from 91.09K xcUSDC to 91.24K xcUSDC
+0% from 163.29K xcUSDC to 163.31K xcUSDC
+0% from 55.79% to 55.87%
xcUSDT
-1% from 81.37K xcUSDT to 80.92K xcUSDT
-2% from 181.69K xcUSDT to 178.48K xcUSDT
+1% from 44.78% to 45.34%
USDC_wh
+1% from 41.88K USDC_wh to 42.33K USDC_wh
-4% from 119.86K USDC_wh to 115.59K USDC_wh
+5% from 34.94% to 36.62%
BTC_wh
0% from 0.10 BTC_wh to 0.10 BTC_wh
0% from 1.19 BTC_wh to 1.19 BTC_wh
0% from 8.41% to 8.41%
xcDOT
+0% from 23.16K xcDOT to 23.17K xcDOT
+0% from 536.57K xcDOT to 536.58K xcDOT
+0% from 100% to 100%
ETH_wh
-0% from 1.24 ETH_wh to 1.24 ETH_wh
-0% from 46.99 ETH_wh to 46.99 ETH_wh
-0% from 2.65% to 2.63%
FRAX
+0% from 447.94 FRAX to 447.94 FRAX
+0% from 40.77K FRAX to 40.77K FRAX
+0% from 44.90% to 44.90%
Total liquidations: 2Total Collateral Seized (USD): $41.64Total Debt Repaid (USD): $37.86Total Liquidation Bonus (USD): $3.79Total Liquidator Bonus (USD): $2.65Total Protocol Bonus (USD): $1.14
Asset
Total Seized (Tokens)
Total Seized (USD)
Debt Repaid (USD)
Liquidation Bonus (USD)
Liquidator Bonus (USD)
Protocol Bonus (USD)
Liquidation Count
GLMR
565.203000
$41.64
$37.86
$3.79
$2.65
$1.14
2
Asset
Current Borrow Cap
Average Borrow Cap Usage (Past Week)
Average Utilization
xcKSM
0.10
6.59M%
43.55%
FRAX
0.10
64.39M%
19.57%
MOVR
0.10
3.57M%
2.41%
Asset
Total Borrow
Total Supply
Utilization
xcKSM
+0% from 6.58K xcKSM to 6.59K xcKSM
-1% from 15.13K xcKSM to 15.06K xcKSM
+1% from 43.50% to 43.76%
FRAX
0% from 64.39K FRAX to 64.39K FRAX
0% from 329.00K FRAX to 329.00K FRAX
0% from 19.57% to 19.57%
MOVR
+0% from 3.57K MOVR to 3.57K MOVR
-1% from 148.66K MOVR to 147.80K MOVR
+1% from 2.40% to 2.42%
No liquidation events on Moonriver this week.
I am also locked out of my xcDOT and have repeatedly communicated with the Moonwell team on Discord, but they have not provided any concrete solutions . I am very disappointed in this project due to its lack of transparency . Moreover, it seems that the administrators on Discord are avoiding answering my questions , possibly because they fear users might discover some opaque or suspicious activities within the project .
1 Like
Hi @AnthiasLabs , could you provide some clarification on the reason the borrow cap is basically zeroed out on Moonbeam? I have a suspicion that you might be looking at Stellaswap’s old v2/v3 pools and seeing near 0 liquidity. A few months ago we migrated to Algebra’s Integral (similar to Uniswap v4) and our pools have new contracts now.
There is about $8 million in liquidity on Stellaswap as of this writing, and a quick test shows a 200k GLMR swap to USDC.xc has a 0.63% price impact.
I’d further note that we’ve migrated away from supporting Wormhole assets and are focusing instead on SnowBridge BTC and ETH.
Hi @ogre44444 , earlier this year Gauntlet decided to go risk-off in the Moonbeam markets by gradually reducing borrow caps and collateral factors. Here in May we see the final proposal that “zeroes out” borrow caps. Since assuming responsibilities in July, we have not yet opted to reverse this stance.
Anthias Labs would like to provide an update on market performance over the past week for Core markets on Base, OP mainnet, Moonbeam, and Moonriver. Data from 8/22/25 to 8/28/25. More information can be found on our monitoring dashboard .
Asset
Current Borrow Cap
Current Supply Cap
Average Borrow Cap Usage (Past Week)
Average Supply Cap Usage (Past Week)
Average Utilization
USDC
184.00M
200.00M
29.70%
30.73%
88.98%
WETH
64.00K
96.00K
29.99%
23.11%
86.48%
USDS
690.00K
750.00K
2.55%
2.75%
85.42%
EURC
21.00M
21.90M
11.48%
13.37%
82.47%
DAI
300.00K
400.00K
6.21%
7.74%
60.19%
VIRTUAL
2.30M
4.50M
33.59%
40.80%
42.26%
AERO
25.00M
70.00M
40.27%
38.09%
37.79%
WELL
75.00M
220.00M
62.69%
75.07%
28.47%
cbBTC
640.00
1.50K
20.62%
45.06%
19.53%
LBTC
38.00
95.00
25.13%
54.15%
18.60%
cbXRP
1.60M
3.00M
20.26%
60.51%
17.85%
tBTC
36.00
90.00
5.17%
12.94%
16.61%
USDbC
1.00
1.00
148.18K%
1.00M%
14.79%
MORPHO
1.00M
6.00M
53.20%
97.58%
9.08%
wrsETH
430.00
1.00K
0.74%
12.04%
2.66%
cbETH
6.40K
16.00K
0.98%
15.08%
2.60%
rETH
900.00
2.60K
2.57%
39.82%
2.23%
wstETH
4.80K
14.40K
2.04%
31.00%
2.20%
weETH
700.00
4.00K
4.80%
75.48%
1.11%
Asset
Total Borrow
Total Supply
Utilization
USDC
+4% from 56.04M USDC to 58.38M USDC
-1% from 62.70M USDC to 61.81M USDC
+6% from 89.38% to 94.46%
WETH
-2% from 18.60K WETH to 18.30K WETH
-1% from 21.60K WETH to 21.45K WETH
-1% from 86.14% to 85.34%
USDS
-6% from 18.54K USDS to 17.42K USDS
+1% from 20.40K USDS to 20.65K USDS
-7% from 90.89% to 84.36%
EURC
-1% from 2.31M EURC to 2.30M EURC
-7% from 2.97M EURC to 2.77M EURC
+7% from 77.96% to 83.03%
DAI
-10% from 20.33K DAI to 18.29K DAI
-0% from 31.01K DAI to 30.86K DAI
-10% from 65.57% to 59.27%
VIRTUAL
-10% from 950.36K VIRTUAL to 853.36K VIRTUAL
-25% from 2.50M VIRTUAL to 1.87M VIRTUAL
+20% from 38.00% to 45.55%
AERO
+2% from 9.90M AERO to 10.14M AERO
-1% from 26.83M AERO to 26.46M AERO
+4% from 36.90% to 38.31%
WELL
-3% from 50.08M WELL to 48.57M WELL
+6% from 161.06M WELL to 171.39M WELL
-9% from 31.09% to 28.34%
cbBTC
-7% from 136.82 cbBTC to 127.33 cbBTC
+0% from 676.72 cbBTC to 679.47 cbBTC
-7% from 20.22% to 18.74%
LBTC
+6% from 9.20 LBTC to 9.73 LBTC
+19% from 43.51 LBTC to 51.58 LBTC
-11% from 21.15% to 18.87%
cbXRP
+28% from 257.11K cbXRP to 328.32K cbXRP
+13% from 1.68M cbXRP to 1.90M cbXRP
+13% from 15.29% to 17.31%
tBTC
+5% from 1.78 tBTC to 1.88 tBTC
+50% from 9.50 tBTC to 14.29 tBTC -30% from 18.77% to 13.15%
USDbC
+0% from 1.48K USDbC to 1.48K USDbC
-0% from 10.03K USDbC to 10.02K USDbC
+0% from 14.77% to 14.79%
MORPHO
-9% from 608.76K MORPHO to 553.37K MORPHO
+0% from 5.92M MORPHO to 5.94M MORPHO
-9% from 10.28% to 9.32%
wrsETH
-0% from 3.20 wrsETH to 3.20 wrsETH
+0% from 120.37 wrsETH to 120.46 wrsETH
-0% from 2.66% to 2.65%
cbETH
-22% from 74.22 cbETH to 57.73 cbETH
+0% from 2.39K cbETH to 2.39K cbETH
-22% from 3.10% to 2.41%
rETH
-1% from 23.18 rETH to 23.06 rETH
-3% from 1.05K rETH to 1.02K rETH
+2% from 2.21% to 2.27%
wstETH
-54% from 200.91 wstETH to 91.92 wstETH -0% from 4.46K wstETH to 4.44K wstETH
-54% from 4.51% to 2.07%
weETH
+2% from 33.34 weETH to 33.84 weETH
-0% from 3.02K weETH to 3.01K weETH
+2% from 1.10% to 1.12%
VIRTUAL supply decreased 25% from 2.50M to 1.87M VIRTUAL
tBTC supply increased 50% from 9.50 to 14.29 tBTC
cbXRP borrows increased 28% from 257.11K to 328.32K cbXRP
wstETH borrows decreased 54% from 200.91 to 91.92 wstETH
Total liquidations: 119Total Collateral Seized (USD): $1,971,411.93Total Debt Repaid (USD): $1,792,192.66Total Liquidation Bonus (USD): $179,219.27Total Liquidator Bonus (USD): $125,453.49Total Protocol Bonus (USD): $53,765.78
Asset
Total Seized (Tokens)
Total Seized (USD)
Debt Repaid (USD)
Liquidation Bonus (USD)
Liquidator Bonus (USD)
Protocol Bonus (USD)
Liquidation Count
USDC
1,838,031.8197
$1,837,788.72
$1,670,717.02
$167,071.70
$116,950.19
$50,121.51
34
AERO
75,415.474802
$97,789.84
$88,899.86
$8,889.99
$6,222.99
$2,667.00
18
WETH
2.646941
$11,495.00
$10,450.00
$1,045.00
$731.50
$313.50
25
cbBTC
0.097611
$10,932.05
$9,938.23
$993.82
$695.68
$298.15
13
WELL
249,529.2
$7,281.72
$6,619.74
$661.97
$463.38
$198.59
6
EURC
2,663.009
$3,109.12
$2,826.47
$282.65
$197.85
$84.79
4
cbXRP
467.093
$1,368.68
$1,244.25
$124.43
$87.10
$37.33
2
VIRTUAL
597.91354
$691.29
$628.44
$62.84
$43.99
$18.85
7
cbETH
0.075168
$392.36
$356.69
$35.67
$24.97
$10.70
1
weETH
0.056265
$279.93
$254.48
$25.45
$17.81
$7.63
1
wstETH
0.035563
$198.82
$180.74
$18.07
$12.65
$5.42
2
LBTC
0.000508
$58.96
$53.60
$5.36
$3.75
$1.61
4
tBTC
0.000206
$23.44
$21.31
$2.13
$1.49
$0.64
1
DAI
2.016010
$2.02
$1.83
$0.18
$0.13
$0.05
1
Asset
Current Borrow Cap
Current Supply Cap
Average Borrow Cap Usage (Past Week)
Average Supply Cap Usage (Past Week)
Average Utilization
USDC
34.00M
36.40M
23.93%
25.00%
89.43%
WETH
30.00K
32.00K
21.70%
22.79%
89.34%
USDT0
8.00M
10.00M
12.66%
11.69%
86.59%
USDT
18.40M
22.60M
2.34%
2.20%
86.48%
DAI
4.50M
4.80M
6.34%
6.98%
84.87%
OP
650.00K
5.60M
45.36%
40.41%
13.04%
rETH
340.00
750.00
1.68%
14.65%
5.56%
wstETH
1.50K
5.00K
2.47%
15.91%
4.67%
WBTC
0.00
0.00
0.00%
0.00%
4.33%
VELO
20.00M
68.00M
10.02%
77.37%
3.82%
wrsETH
160.00
400.00
0.40%
6.00%
2.64%
weETH
220.00
1.20K
6.20%
100.01%
1.14%
cbETH
0.00
10.00
0.00%
8.07%
0.02%
Asset
Total Borrow
Total Supply
Utilization
USDC
-4% from 9.81M USDC to 9.43M USDC
-4% from 10.98M USDC to 10.57M USDC
-0% from 89.36% to 89.23%
WETH
+6% from 7.49K WETH to 7.95K WETH
+7% from 8.47K WETH to 9.10K WETH
-1% from 88.38% to 87.40%
USDT0
+2% from 934.32K USDT0 to 953.65K USDT0
-4% from 1.12M USDT0 to 1.07M USDT0
+7% from 83.22% to 88.79%
USDT
-7% from 373.49K USDT to 348.86K USDT
-6% from 443.55K USDT to 417.78K USDT
-1% from 84.21% to 83.50%
DAI
+75% from 252.81K DAI to 443.06K DAI +62% from 303.24K DAI to 491.90K DAI +8% from 83.37% to 90.07%
OP
-1% from 296.07K OP to 293.06K OP
+5% from 2.16M OP to 2.28M OP
-6% from 13.72% to 12.88%
rETH
-38% from 7.32 rETH to 4.55 rETH
-16% from 101.20 rETH to 85.35 rETH
-26% from 7.23% to 5.34%
wstETH
+14% from 35.15 wstETH to 40.03 wstETH
-7% from 840.85 wstETH to 784.26 wstETH
+22% from 4.18% to 5.10%
WBTC
0% from 0.00 WBTC to 0.00 WBTC
0% from 0.07 WBTC to 0.07 WBTC
+0% from 4.33% to 4.33%
VELO
-6% from 2.14M VELO to 2.01M VELO
+7% from 50.01M VELO to 53.37M VELO
-12% from 4.29% to 3.76%
wrsETH
0% from 0.63 wrsETH to 0.63 wrsETH
+0% from 24.01 wrsETH to 24.01 wrsETH
+0% from 2.64% to 2.64%
weETH
+7% from 13.10 weETH to 13.98 weETH
+0% from 1.20K weETH to 1.20K weETH
+7% from 1.09% to 1.16%
cbETH
0% from 0.00 cbETH to 0.00 cbETH
-1% from 0.81 cbETH to 0.81 cbETH
+1% from 0.02% to 0.02%
DAI supply increased 62% from 303.24K to 491.90K DAI
DAI borrows increased 75% from 252.81K to 443.06K DAI
Total liquidations: 3Total Collateral Seized (USD): $498.15Total Debt Repaid (USD): $452.86Total Liquidation Bonus (USD): $45.29Total Liquidator Bonus (USD): $31.70Total Protocol Bonus (USD): $13.59
Asset
Total Seized (Tokens)
Total Seized (USD)
Debt Repaid (USD)
Liquidation Bonus (USD)
Liquidator Bonus (USD)
Protocol Bonus (USD)
Liquidation Count
USDC
492.059
$492.01
$447.29
$44.73
$31.31
$13.42
1
WETH
0.000998
$4.71
$4.28
$0.43
$0.30
$0.13
1
DAI
1.42638
$1.43
$1.30
$0.13
$0.09
$0.04
1
Asset
Current Borrow Cap
Average Borrow Cap Usage (Past Week)
Average Utilization
xcUSDC
0.10
89.72M%
66.17%
GLMR
0.10
6783.27M%
63.50%
xcUSDT
0.10
77.94M%
51.91%
USDC_wh
0.10
42.64M%
36.71%
BTC_wh
0.10
99.99%
8.40%
xcDOT
0.10
23.17M%
100%
ETH_wh
0.10
1.22K%
2.61%
FRAX
0.10
447.94K%
44.90%
Asset
Total Borrow
Total Supply
Utilization
xcUSDC
-7% from 91.24K xcUSDC to 84.55K xcUSDC
-14% from 163.31K xcUSDC to 139.77K xcUSDC
+8% from 55.87% to 60.50%
GLMR
+1% from 6.75M GLMR to 6.81M GLMR
+0% from 10.70M GLMR to 10.75M GLMR
+0% from 63.14% to 63.41%
xcUSDT
-8% from 80.92K xcUSDT to 74.50K xcUSDT
-22% from 178.48K xcUSDT to 139.04K xcUSDT
+18% from 45.34% to 53.58%
USDC_wh
+1% from 42.33K USDC_wh to 42.84K USDC_wh
+1% from 115.59K USDC_wh to 117.02K USDC_wh
-0% from 36.62% to 36.61%
BTC_wh
-0% from 0.10 BTC_wh to 0.10 BTC_wh
+0% from 1.19 BTC_wh to 1.19 BTC_wh
-0% from 8.41% to 8.40%
xcDOT
+0% from 23.17K xcDOT to 23.17K xcDOT
+0% from 536.58K xcDOT to 536.58K xcDOT
+0% from 100% to 100%
ETH_wh
-2% from 1.24 ETH_wh to 1.21 ETH_wh
-14% from 46.99 ETH_wh to 40.43 ETH_wh
+14% from 2.63% to 3.00%
FRAX
0% from 447.94 FRAX to 447.94 FRAX
0% from 40.77K FRAX to 40.77K FRAX
+0% from 44.90% to 44.90%
Total liquidations: 1Total Collateral Seized (USD): $128.83Total Debt Repaid (USD): $117.12Total Liquidation Bonus (USD): $11.71Total Liquidator Bonus (USD): $8.20Total Protocol Bonus (USD): $3.51
Asset
Total Seized (Tokens)
Total Seized (USD)
Debt Repaid (USD)
Liquidation Bonus (USD)
Liquidator Bonus (USD)
Protocol Bonus (USD)
Liquidation Count
GLMR
1,642.150000
$128.83
$117.12
$11.71
$8.20
$3.51
1
Asset
Current Borrow Cap
Average Borrow Cap Usage (Past Week)
Average Utilization
xcKSM
0.10
6.57M%
42.48%
FRAX
0.10
64.39M%
19.57%
MOVR
0.10
3.57M%
2.38%
Asset
Total Borrow
Total Supply
Utilization
xcKSM
-1% from 6.59K xcKSM to 6.51K xcKSM
+4% from 15.06K xcKSM to 15.72K xcKSM
-5% from 43.76% to 41.39%
FRAX
0% from 64.39K FRAX to 64.39K FRAX
0% from 329.00K FRAX to 329.00K FRAX
0% from 19.57% to 19.57%
No liquidations on Moonriver this week.
Could you describe what you would need to see on Moonbeam to raise the caps? Is it just a matter of dex liquidity depth (and if so, what’s the minimum required) and if not, what else?
In short, raising caps on Moonbeam primarily hinges on improving DEX liquidity, but it’s not just about hitting a specific minimum threshold. It’s about ensuring the overall risk in the Moonbeam markets remains manageable. The Moonbeam markets are based on an older fork of Compound that lacks the supply cap parameter, meaning users can supply an uncapped amount of any asset. Therefore the main tool we have to limit exposure in these markets is the borrow cap. In a pooled lending model like this, the health and stability of the entire market are tied to its weakest link. Namely, the most risky or illiquid asset. Because the markets lack supply caps, we can’t isolate risks easily, so any borrow cap increases must account for these weak links.
For instance, if we raised the borrow cap on GLMR (which has decent liquidity on Moonbeam), a user could supply an uncapped amount of Wormhole ETH (which has virtually no liquidity) as collateral and borrow GLMR up to the new limit. This could expose the protocol to liquidation challenges: liquidators might struggle to swap sized Wormhole ETH for stables directly on a DEX, forcing them to bridge assets elsewhere for liquidity. That introduces unnecessary dependencies, timing risks, etc. which we’d want to avoid.
To raise borrow caps confidently, we’d first need to phase out the markets of illiquid assets such as Wormhole ETH, FRAX, etc. essentially removing the weak links.