[Anthias Labs] - Minimum Reserves Recommendations (6/2/2025)
Introduction
The following report contains recommendations for setting minimum reserves in Moonwell’s Core markets on Base for June. As part of the Anthias Lab’s ongoing partnership with Moonwell, we are committed to delivering monthly updates and proposals to optimize reserve levels, ensuring the protocol remains safe in the face of bad debt.
Methodology
Our goal is to establish minimum reserves proportional to the maximum borrow capacity of a market, defined as the supply cap multiplied by the collateral factor (CF). This metric reflects the maximum potential debt within a given market. For each collateral asset, we assign a reserve coverage ratio based on its overall risk profile. This ratio, expressed as a percentage, represents the minimum reserves relative to the maximum borrow capacity in a market.

To assess the state of reserves given current reserve levels and current supply we have:

As the supply of a market grows over time, and reserves are accrued, we wish to see Current Reserve Coverage Ratio greater than or equal to Reserve Coverage Ratio. This tells us if we have an adequate amount of reserves in a particular market, given the current supply levels.

For each collateral asset we suggest a Reserve Coverage Ratio (RCR), which gives a standardized method for calculating minimum reserves:

This enables us to address the distinct risk profiles of each collateral asset while ensuring a standardized approach to reserve management across all markets. To assign the appropriate RCR for each asset, we perform a risk assessment evaluating multiple factors, including historical price volatility, secondary market liquidity, correlation with underlying assets (where relevant), asset maturity, and exposure to unique tail risks.
Based on this assessment we categorize assets into risk tiers (e.g., low, medium, high), with each tier corresponding to a range of RCRs. For example:
- Low-risk (e.g., highly liquid stables): 0.2%-0.4%
- Medium-risk (e.g., established cryptoassets): 0.4%-1%
- High-risk (e.g., LRTs or volatile gov tokens): 1%-2%
Current Reserves & Recommendations
| Asset | Price | Current RCR | Recommended RCR | Current reserves (tokens) | Recommended min reserves (Tokens) | Current reserves (USD) | Recommended min reserves (USD) |
|---|---|---|---|---|---|---|---|
| WETH | $ 2,540.00 | 1.29% | 0.50% | 301.83 | 403.20 | $ 766,648 | $ 1,048,320 |
| USDC | $ 1.00 | 0.61% | 0.30% | 530,911.48 | 528,000.00 | $ 530,911 | $ 528,000 |
| cbBTC | $ 104,326.00 | 0.26% | 0.40% | 1.50 | 5.10 | $ 156,489 | $ 537,234 |
| AERO | $ 0.52 | 1.18% | 1.20% | 211,098.62 | 546,000.00 | $ 109,771 | $ 289,380 |
| cbETH | $ 2,794.00 | 1.02% | 0.60% | 22.82 | 77.76 | $ 63,759 | $ 221,616 |
| wstETH | $ 3,056.00 | 0.56% | 0.60% | 20.42 | 69.98 | $ 62,403 | $ 218,350 |
| WELL | $ 0.04 | 2.12% | 1.80% | 1,216,946.65 | 1,755,000.00 | $ 49,408 | $ 70,200 |
| EURC | $ 1.13 | 0.95% | 0.40% | 34,359.44 | 77,088.00 | $ 38,826 | $ 87,109 |
| weETH | $ 2,713.00 | 0.67% | 1.00% | 10.49 | 31.20 | $ 28,459 | $ 86,424 |
| LBTC | $ 104,326.00 | 0.64% | 0.60% | 0.24 | 0.48 | $ 25,038 | $ 51,037 |
| VIRTUAL | $ 2.07 | 0.99% | 1.20% | 7,840.58 | 35,490.00 | $ 16,230 | $ 73,819 |
| rETH | $ 2,888.00 | 0.25% | 0.60% | 2.53 | 12.17 | $ 7,306 | $ 35,895 |
| DAI | $ 1.00 | 14.61% | 0.40% | 2,673.22 | 800.00 | $ 2,673 | $ 800 |
| wrsETH | $ 2,653.00 | 0.37% | 1.00% | 0.78 | 7.40 | $ 2,069 | $ 20,054 |
| tBTC | $ 104,119.00 | 0.19% | 0.60% | 0.02 | 0.46 | $ 2,082 | $ 48,383 |
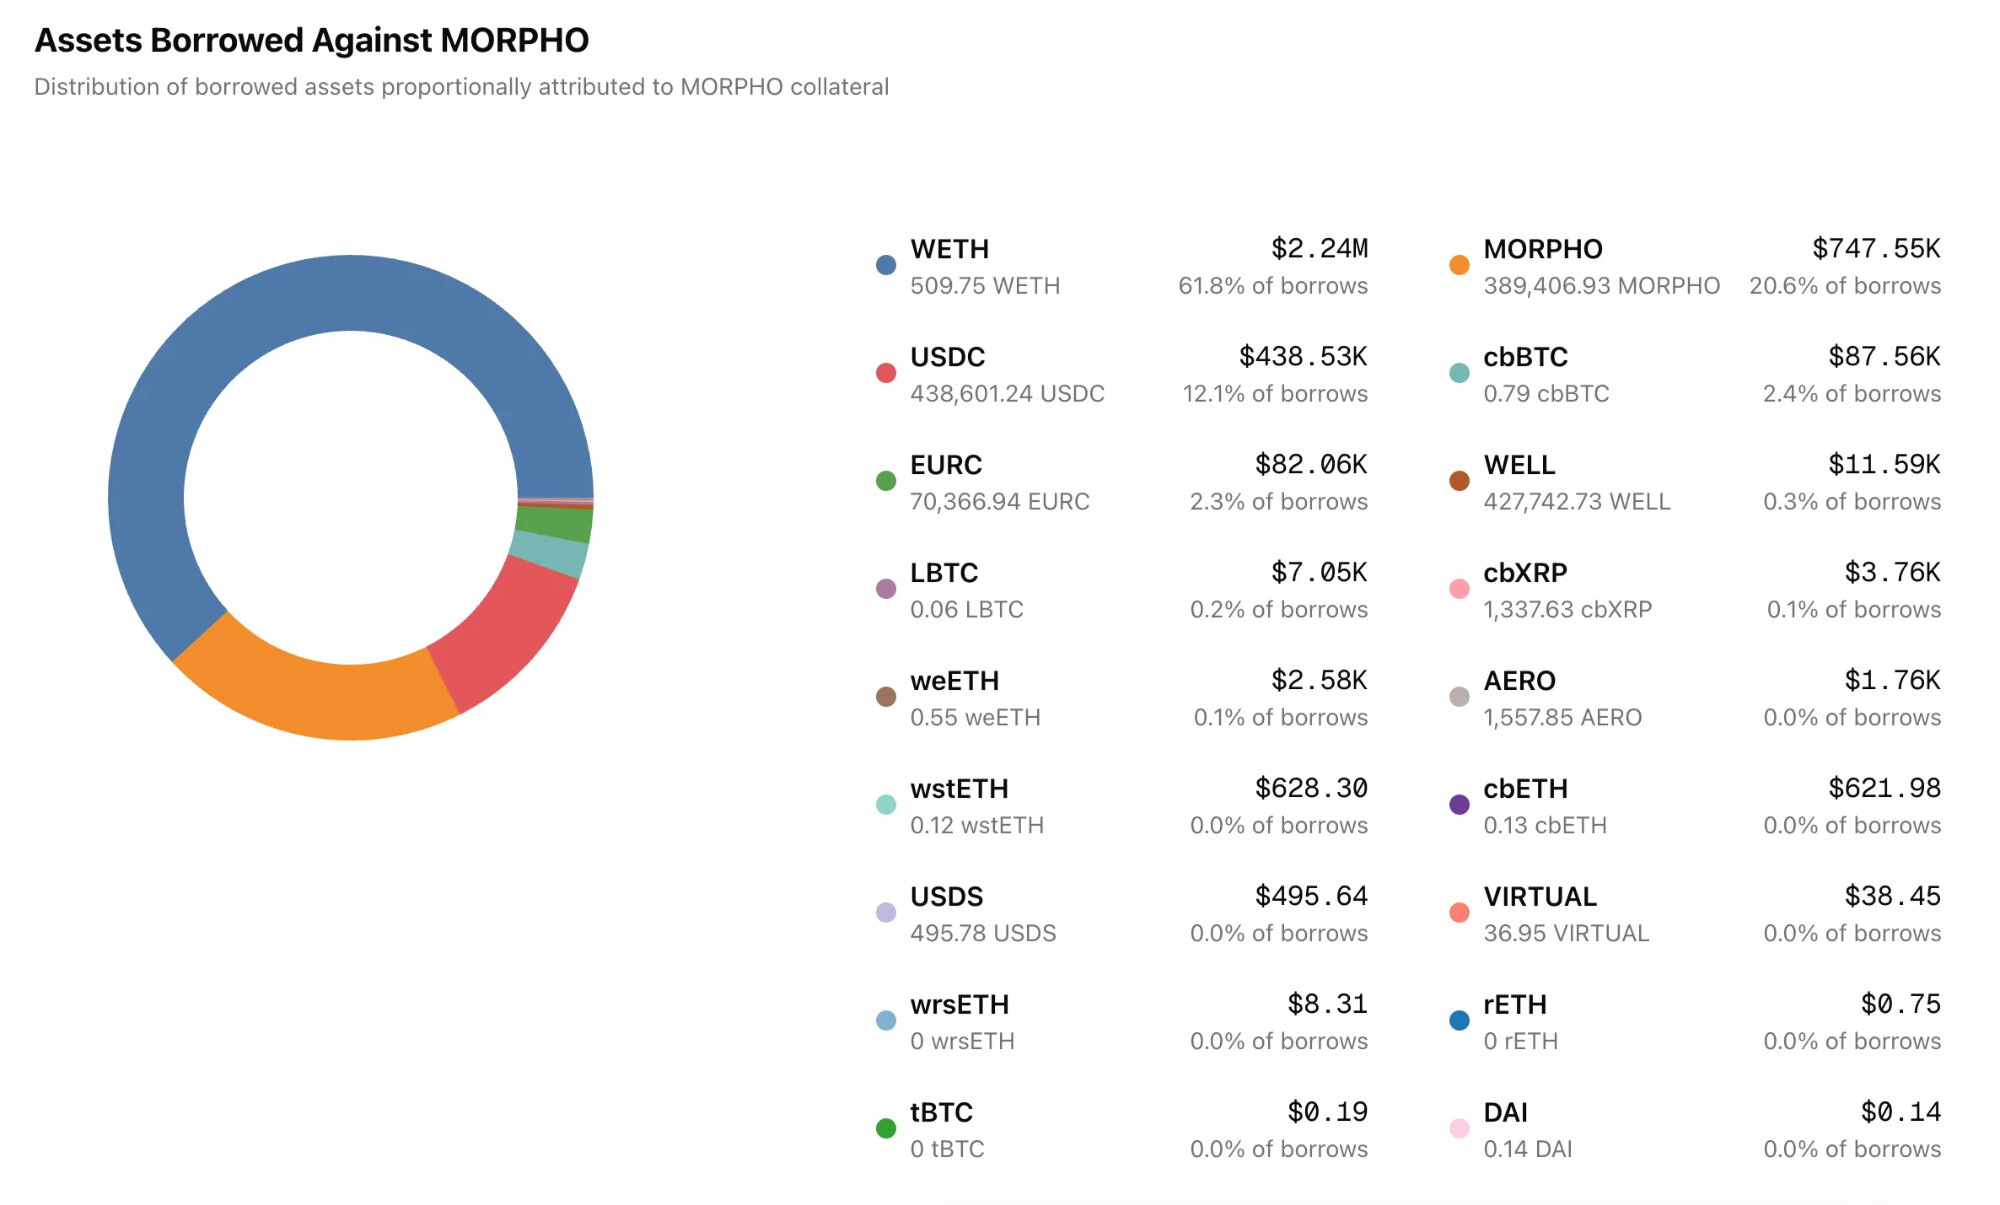
| MORPHO | $ 1.31 | 0.55% | 1.80% | 1,015.44 | 46,800.00 | $ 1,330 | $ 64,116 |
| USDS | $ 1.00 | 0.04% | 0.40% | 5.38 | 2,490.00 | $ 5.38 | $ 2,490 |
| Total | $ 1,863,411.56 | $ 3,333,423.44 |
Certain markets, such as cbBTC, weETH, VIRTUAL, rETH, wrsETH, tBTC, MORPHO, and USDS, currently exhibit reserve coverage ratios (RCRs) that fall below our recommended thresholds. This shortfall is partly attributable to the relatively recent introduction of these markets, which has limited the time available for reserve accumulation. Addressing this issue presents challenges, with no straightforward immediate solution. For instance, raising reserve factors has little effect in markets with virtually no borrowing activity, leaving the protocol with few levers to pull to address reserve deficiencies. Subsidizing reserves from higher-performing markets could be a feasible strategy to strengthen these underfunded markets, which, as detailed further below, are among the slowest in accumulating reserves.
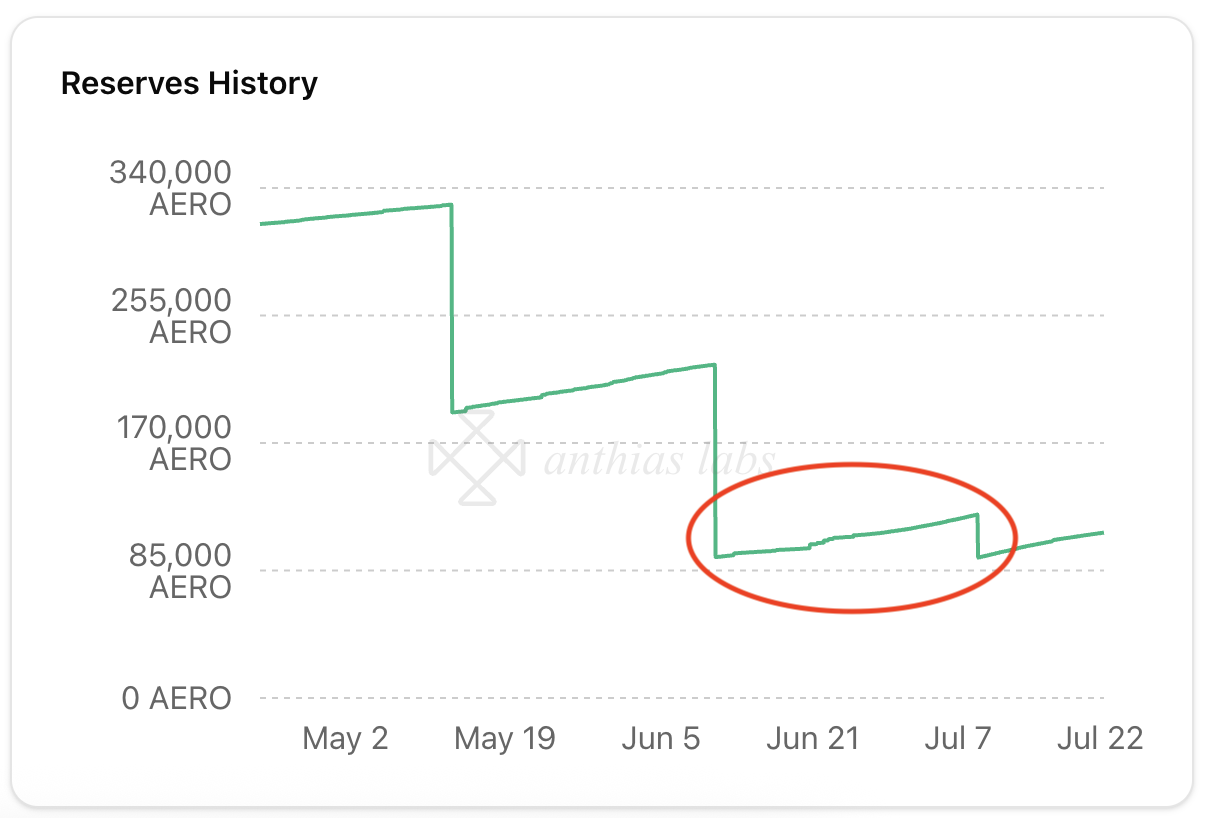
Reserve Accrual
We aim to determine the rate at which reserves accumulate from two main sources: borrower interest and liquidations. To estimate the annual reserves from borrower interest, we use the formula:

Here, Total Borrows and Borrow APY reflect current market conditions.
For reserves from liquidations, we rely on historical data on collateral seized over the past year. Using this, we calculate total liquidation incentives and determine the portion allocated to reserves.
Reserves from Borrower Interest
| Assets | Price | Total borrowed (token) | Reserve factor | Borrow APY | Estimated reserves from borrower interest (tokens) | Estimated reserves from borrower interest (USD) |
|---|---|---|---|---|---|---|
| WETH | $ 2,540.00 | 22,794.92 | 10.00% | 1.50% | 34.19 | $ 86,848.65 |
| USDC | $ 1.00 | 90,058,323.39 | 10.00% | 4.40% | 396,256.62 | $ 396,256.62 |
| cbBTC | $ 104,326.00 | 114.18 | 5.00% | 1.10% | 0.06 | $ 6,551.57 |
| AERO | $ 0.52 | 10,165,346.89 | 30.00% | 9.80% | 298,861.20 | $ 155,407.82 |
| cbETH | $ 2,794.00 | 110.39 | 15.00% | 0.20% | 0.03 | $ 92.53 |
| wstETH | $ 3,056.00 | 192.57 | 15.00% | 0.20% | 0.06 | $ 176.55 |
| WELL | $ 0.04 | 15,681,624.03 | 25.00% | 3.90% | 152,895.83 | $ 6,207.57 |
| EURC | $ 1.13 | 2,792,045.57 | 5.00% | 4.20% | 5,863.30 | $ 6,625.52 |
| weETH | $ 2,713.00 | 33.55 | 15.00% | 0.20% | 0.01 | $ 27.31 |
| LBTC | $ 104,326.00 | 9.63 | 5.00% | 1.50% | 0.01 | $ 753.49 |
| VIRTUAL | $ 2.07 | 631,036.70 | 30.00% | 12.60% | 23,853.19 | $ 49,376.10 |
| rETH | $ 2,888.00 | 23.46 | 30.00% | 0.10% | 0.01 | $ 20.33 |
| DAI | $ 1.00 | 22,026.72 | 100.00% | 25.50% | 5,616.81 | $ 5,616.81 |
| wrsETH | $ 2,653.00 | 1.57 | 15.00% | 0.00% | 0.00 | $ 0.00 |
| tBTC | $ 104,119.00 | 6.22 | 5.00% | 3.60% | 0.01 | $ 1,165.72 |
| MORPHO | $ 1.31 | 519,162.09 | 35.00% | 5.30% | 9,630.46 | $ 12,615.90 |
| USDS | $ 1.00 | 8,784.80 | 10.00% | 4.10% | 36.02 | $ 36.02 |
| Total | $ 727,778.50 |
Reserves From Liquidation Incentives
From 5/31/24 to 5/31/25
Source: Sentora Risk Radar - Real-time Economic Risk Analysis for DeFi - Stay One Step Ahead
| Assets | Collateral seized | Liquidation incentive | Incentive going to liquidators (7%) | Incentive going to reserves (3%) |
|---|---|---|---|---|
| WETH | $ 17,467,262.11 | $ 1,587,932.92 | $ 1,111,553.04 | $ 476,379.88 |
| USDC | $ 1,537,999.76 | $ 139,818.16 | $ 97,872.71 | $ 41,945.45 |
| cbBTC | $ 3,914,734.69 | $ 355,884.97 | $ 249,119.48 | $ 106,765.49 |
| AERO | $ 8,132,863.45 | $ 739,351.22 | $ 517,545.86 | $ 221,805.37 |
| cbETH | $ 1,675,104.31 | $ 152,282.21 | $ 106,597.55 | $ 45,684.66 |
| wstETH | $ 1,640,290.17 | $ 149,117.29 | $ 104,382.10 | $ 44,735.19 |
| WELL | $ 853,717.96 | $ 77,610.72 | $ 54,327.51 | $ 23,283.22 |
| EURC | $ 245,541.34 | $ 22,321.94 | $ 15,625.36 | $ 6,696.58 |
| weETH | $ 853,044.73 | $ 77,549.52 | $ 54,284.66 | $ 23,264.86 |
| LBTC | $ 828,854.40 | $ 75,350.40 | $ 52,745.28 | $ 22,605.12 |
| VIRTUAL | $ 51,767.48 | $ 4,706.13 | $ 3,294.29 | $ 1,411.84 |
| rETH | $ 132,747.37 | $ 12,067.94 | $ 8,447.56 | $ 3,620.38 |
| DAI | $ 11,059.12 | $ 1,005.37 | $ 703.76 | $ 301.61 |
| wrsETH | $ 56,296.24 | $ 5,117.84 | $ 3,582.49 | $ 1,535.35 |
| tBTC | $ 35,547.43 | $ 3,231.58 | $ 2,262.11 | $ 969.48 |
| MORPHO | $ 802.28 | $ 72.93 | $ 51.05 | $ 21.88 |
| USDS | $ 110.25 | $ 10.02 | $ 7.02 | $ 3.01 |
| Total | $ 37,437,743.09 | $ 3,403,431.19 | $ 2,382,401.83 | $ 1,021,029.36 |
Combining Both Sources
By summing the estimated annual reserves from borrower interest and the prior year’s liquidation reserves, we can project the total annual reserve accrual, assuming stable market conditions and similar liquidation volume. This offers a view of how long it may take for reserves to meet their minimum levels. We calculate the time to fill, or the estimated number of years required for reserves to reach minimum levels, as:

| Assets | Total annual accrual | Reserves needed to reach minimum | Time to fill (years) |
|---|---|---|---|
| WETH | $ 563,228.52 | $ 257,479.80 | 0.46 |
| USDC | $ 438,202.07 | $ 0 | 0 |
| cbBTC | $ 113,317.06 | $ 375,573.60 | 3.31 |
| AERO | $ 377,213.19 | $ 174,148.72 | 0.46 |
| cbETH | $ 45,777.19 | $ 153,502.36 | 3.35 |
| wstETH | $ 44,911.73 | $ 151,467.58 | 3.37 |
| WELL | $ 29,490.79 | $ 21,844.97 | 0.74 |
| EURC | $ 13,322.11 | $ 48,283.27 | 3.62 |
| weETH | $ 23,292.16 | $ 56,186.23 | 2.41 |
| LBTC | $ 23,358.61 | $ 25,507.71 | 1.09* |
| VIRTUAL | $ 50,787.94 | $ 57,234.30 | 1.13* |
| rETH | $ 3,640.71 | $ 27,834.54 | 7.65 |
| DAI | $ 5,918.43 | $ 0 | 0 |
| wrsETH | $ 1,535.35 | $ 17,562.86 | 11.44 |
| tBTC | $ 2,135.19 | $ 45,708.24 | 21.41* |
| MORPHO | $ 12,637.78 | $ 59,977.77 | 4.75* |
| USDS | $ 39.02 | $ 2,484.62 | 63.67* |
| Total | $ 1,748,807.86 | $ 1,474,796.58 |
*Some assets have not been listed for a full calendar year, and therefore reserves from liquidations are understated.
Given the total annual accrual is greater than the reserves required to reach minimum thresholds, if funds were continuously redistributed to where they’re needed most it would be possible to fully fill reserves in under a year at current rates. However, this could pose a significant engineering task, and require the Moonwell Foundation to navigate complex regulatory requirements to ensure they do not retain custody of transferred assets. By contrast the Safety Module, holding over $34 M in staked WELL, provides a significant second line of defense, with 30% of WELL available to cover losses beyond reserve capacity. While achieving fuller reserve coverage remains a goal, the Safety Module’s substantial presence means this type of solution is not an immediate priority.
In this recommendation, we do not suggest increasing USDC reserves from their current level, enabling these reserves to be auctioned. As USDC is one of the fastest-growing reserves on Moonwell, a substantial portion can still be auctioned for WELL to fund Safety Module staking rewards. A concern with increasing minimum reserves across the board is that it would effectively pause excess reserve auctions. Halting these auctions would reduce the WELL allocated to Safety Module rewards, potentially discouraging staking and inadvertently lowering overall insurance coverage.
Conclusion
Reserves are projected to grow by more than $1.7 M per year, and the Safety Module holds $10 M in readily deployable capital. Together they give the protocol ample capacity to cover shortfalls. We will continue to monitor reserve levels closely, providing monthly updates and urgent recommendations as needed. Throughout our work with Moonwell, we are committed to refining our minimum reserve framework to keep pace with the evolving DeFi landscape and to safeguard the protocol’s long-term stability.
Legal Disclaimer
Anthias LLC (D.B.A. Anthias Labs) does not provide financial advice. Any information accepted here is accepted on the behest of the protocol/DAO. Anthias Labs is not permitted to give financial advice, and nothing in this documentation should be considered as such. Anthias Labs will not be held liable for any economic or otherwise monetary loss brought about by statements made in this document. This is not financial advice, and any third party reading this document should do its own research into any statement made.