[Anthias Labs] Minimum Reserve Recommendations (9/8/25) (Base)
Summary
| Asset | Recommended Reserves (Tokens) | Recommended Reserves (USD) |
|---|---|---|
| WETH | 320 | $1,405,215.36 |
| USDC | 430000 | $430,000.00 |
| cbBTC | 3 | $324,869.57 |
| AERO | 130000 | $149,110.00 |
| EURC | 84000 | $98,112.00 |
| cbETH | 9 | $43,424.39 |
| wstETH | 6.6 | $35,059.17 |
| MORPHO | 18000 | $34,668.00 |
| WELL | 1200000 | $33,600.00 |
| weETH | 6 | $28,232.30 |
| rETH | 4 | $20,005.64 |
| LBTC | 0.228 | $24,702.17 |
| tBTC | 0.216 | $23,385.28 |
| cbXRP | 6000 | $16,650.00 |
| VIRTUAL | 6000 | $6,678.00 |
| wrsETH | 1 | $4,609.96 |
| USDS | 2760 | $2,760.00 |
| DAI | 900 | $900.00 |
| Total: $2,681,981.82 |
Methodology
The foundation for informed minimum reserve recommendations begins with the Anthias Liquip Score, which measures the probability of position liquidation within t days. Unlike health factors that simply calculate collateral-to-debt ratios weighted by collateral factor, the Liquip Score recognizes that liquidation risk arises from the complex interplay of asset price movements, correlations, interest rates, and time. The core insight here is that health factors can be misleading. A position with a high health factor may still face significant liquidation risk if it holds volatile assets that are negatively correlated. Conversely, a recursive position that supplies and borrows the same asset can have a health factor near 1 with virtually no liquidation risk. The Liquip Score provides a more accurate assessment of liquidation risk in scenarios with varying asset volatility and combinations of collateral and debt.
To calculate the Liquip Score, we model wallet position returns as a random variable characterized by mean (µ) and variance (σ²). Together, these parameters provide a clear view of the position’s expected performance and risk. The mean µ represents the average daily return for the wallet position, accounting for asset proportions, their historical returns, and daily debt interest rates. Similarly, variance σ² represents the volatility of daily combined returns, factoring in asset proportions, historical returns, and correlations between assets.
Building on these parameters, we compute the Anthias Liquip Score, which provides a probabilistic measure of the likelihood that a wallet’s position value falls below a certain threshold within t days. Our methodology assumes that position value follows a log-normal distribution and that daily returns follow a normal distribution. These assumptions allow us to use geometric Brownian motion, a standard financial modeling tool, to calculate the probability of value dropping below a set threshold within a specified timeframe.
While the Liquip Score provides valuable insights into liquidation probability, we ultimately need to understand the economic impact of these risks. This is where Collateral-at-Risk (CaR) becomes essential. For each lending position, CaR represents the expected value of collateral that will be liquidated within the specified time horizon. The calculation follows a straightforward formula: CaR equals Liquip Score multiplied by Maximum Liquidation Amount.
The Maximum Liquidation Amount uses the minimum of two constraints. First, 110% of total debt value, which accounts for liquidation bonuses that incentivize liquidators to perform liquidations. When liquidators repay a borrower’s debt, they unlock an equivalent value of collateral plus 10%. Second, 50% of total collateral value, which represents the 50% close factor implemented by Moonwell that caps the amount of collateral liquidatable in a single transaction.
Consider an example: a position with $1 million in collateral and $800,000 in debt facing a 10% liquidation probability. The Maximum Liquidation Amount would be the minimum of $800,000 × 1.10 ($880,000) and $1,000,000 × 0.50 ($500,000), which equals $500,000. The resulting CaR would be 10% × $500,000 = $50,000. When positions hold multiple types of collateral, CaR is distributed proportionally across assets based on their relative values within the position. However, since liquidators can choose any proportion of collateral to seize in practice, CaR represents only an approximation.
By summing CaR across all positions, we gain insights into which assets bear the greatest liquidation risk. This aggregation reveals vulnerabilities that individual position analysis cannot capture: the concentration of liquidation risk in specific markets and the potential strain these liquidations could place on DEX liquidity. The most concerning markets are those with high CaR relative to the amount that can be swapped on DEXs under 7% slippage, which represents the liquidator incentive threshold.
The relationship between CaR and available DEX liquidity determines whether liquidations can occur efficiently. We analyze this by simulating large liquidation transactions on DEXs to understand the price impact of selling CaR volumes. Markets with high CaR and correspondingly high slippage pose elevated risk to the protocol. When slippage exceeds liquidation bonuses of 7%, liquidations become unprofitable. This creates dangerous conditions where positions remain underwater despite being eligible for liquidation, potentially leading to bad debt accumulation.
The main scenario that minimum reserves aim to protect against follows a predictable pattern. First, collateral value sharply declines. Then liquidations become unprofitable due to strained DEX liquidity. Finally, bad debt accumulates in the form of whatever asset was borrowed against that collateral. Understanding which assets are borrowed against high-risk collateral reveals the specific vectors through which bad debt can accumulate.
We analyze the distribution of borrowed assets for each type of collateral, identifying the debt assets most exposed to liquidation failures. The critical insight emerges from mapping these collateral-debt relationships. When volatile collateral assets face concentrated liquidation pressure, the borrowed assets become at risk of bad debt accumulation. This analysis identifies which borrowed assets require the largest reserve buffers, as assets frequently borrowed against high-risk collateral need proportionally larger reserves to absorb potential bad debt during market stress events. Below is a snapshot of CaR on September 2, 2025, using Liquip Scores with t=30.
| Token | 30d CAR USD | CAR Tokens | Positions |
|---|---|---|---|
| AERO | $1,520,236 | 1391279.57 | 1,229 |
| USDC | $928,366 | 928522.31 | 1,614 |
| CBBTC | $743,745 | 6.84 | 767 |
| WEETH | $672,184 | 146.61 | 78 |
| WELL | $510,407 | 19306558.87 | 307 |
| MORPHO | $458,385 | 244685.86 | 222 |
| WETH | $346,313 | 80.95 | 1,347 |
| WSTETH | $264,939 | 51.18 | 306 |
| CBETH | $224,780 | 47.80 | 338 |
| CBXRP | $95,788 | 34481.82 | 129 |
| VIRTUAL | $73,655 | 72827.06 | 400 |
| TBTC | $50,138 | 0.46 | 76 |
| LBTC | $38,716 | 0.36 | 83 |
| WRSETH | $17,025 | 3.79 | 38 |
| RETH | $12,332 | 2.53 | 124 |
| EURC | $8,608 | 7404.34 | 230 |
| USDS | $44 | 44.08 | 47 |
| DAI | $13 | 13.24 | 45 |
When we input each market’s 30-day CaR into a DEX aggregator, nearly all markets return less than 1% slippage, indicating healthy liquidation conditions. However, two critical exceptions emerge: WELL shows 5.6% slippage and MORPHO shows 8.3% slippage. This elevated slippage approaches or exceeds the 7% liquidation bonus threshold, creating conditions where liquidations could become unprofitable if attempted all at once. However, multiple smaller liquidations are likely able to relieve debt even in extreme scenarios, as DEX pools are arbitraged back to equilibrium between liquidation waves. This natural market mechanism allows liquidators to work through positions gradually while maintaining profitability, reducing the risk of cascading bad debt accumulation. Additionally, conservative collateral factors in these markets increase the buffer between liquidation and bad debt, providing extra protection against sudden market movements and giving liquidators more time to process underwater positions before they become insolvent.
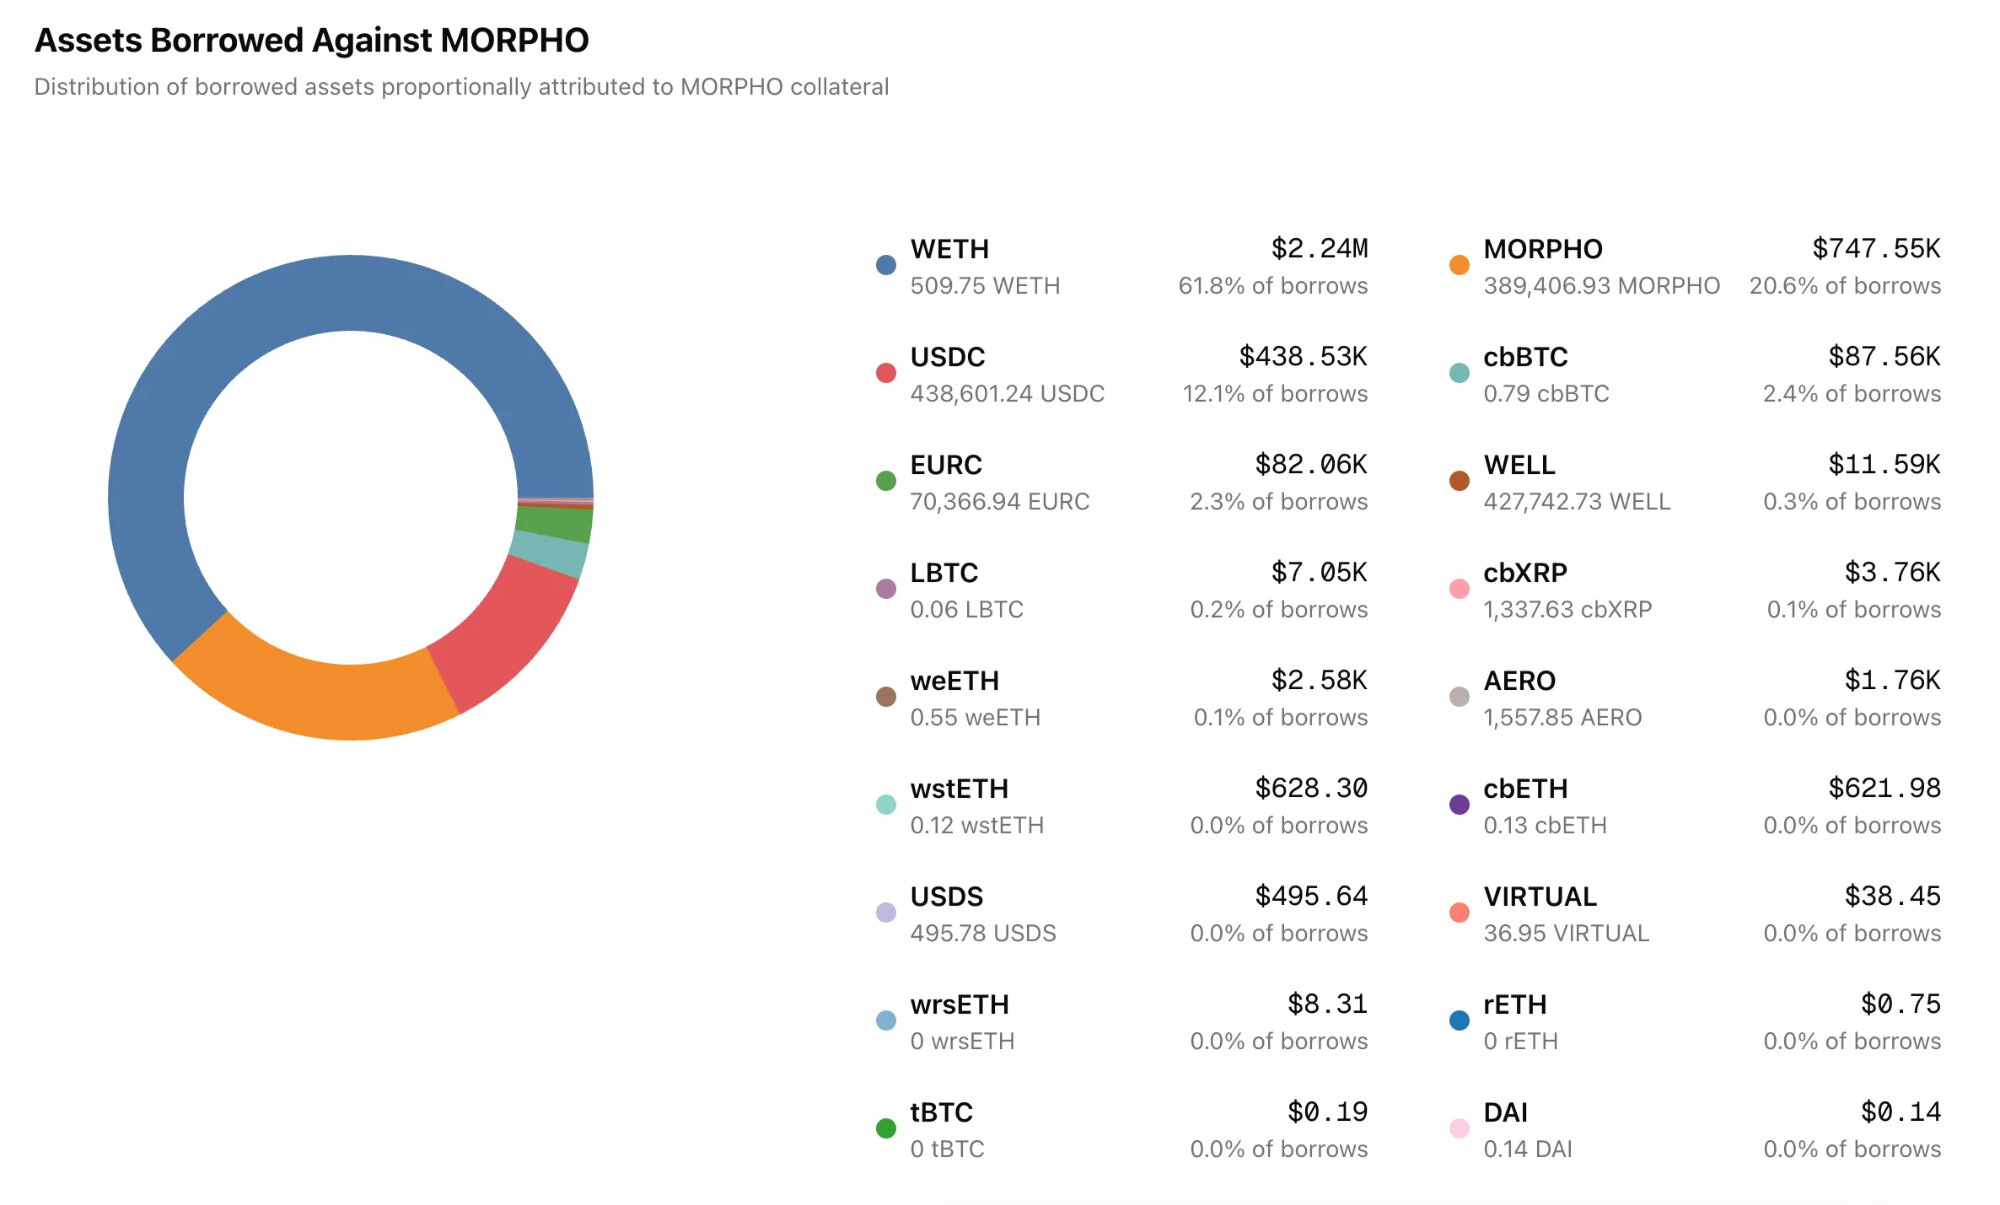
Looking at which assets users borrow when supplying WELL and MORPHO provides the final piece of the puzzle. For WELL collateral, USDC dominates at 87.6% of borrows ($1.38M), followed by EURC at 6.1% ($96K). For MORPHO collateral, WETH leads at 61.8% of borrows ($2.24M), with MORPHO itself representing 20.6% ($747K) in recursive positions, and USDC at 12.1% ($438K).

Based on this analysis, WETH, USDC, EURC, and cbBTC emerge as the most common assets borrowed against these higher-risk markets. The combination of high CaR in WELL and MORPHO markets, their elevated DEX slippage, and the concentration of borrowing in these four assets creates clear reserve allocation priorities. These markets require higher reserve buffers to absorb potential bad debt when liquidations fail due to unprofitable slippage conditions. Therefore, a higher amount of reserves should be allocated to WETH, USDC, EURC, and cbBTC markets in particular, as they bear the greatest exposure to bad debt accumulation during stressed market conditions.
Safety Staking Module
Moonwell’s safety staking module enables users to stake WELL tokens, which can be slashed if the protocol requires funds to cover insolvencies. In return for accepting this slashing risk, users earn yield from staking. The safety staking module receives funding through monthly reserve auctions, where excess reserves are sold for WELL tokens that become staking rewards. Since the safety module provides critical shortfall insurance and reserve auctions incentivize staking, these auctions effectively help secure the protocol against shortfalls.
Reserve auctions create a multiplier effect for insurance coverage. While directly allocating reserves to a market provides 1:1 insurance coverage, auctioning those same reserves monthly attracts stakers who collectively provide nearly 4x the shortfall insurance than current reserves do. A certain amount of reserves should therefore be auctioned off every month to keep staking yields attractive. This achieves two key objectives: it provides shortfall insurance and generates demand for WELL tokens, as users can stake them to earn high yield.
The minimum reserve strategy moving forward takes into account auctioning off a fair amount of reserves while simultaneously prioritizing growth in markets that need it most. This requires careful consideration of reserve accrual rates in each market. For markets targeted for long-term reserve growth, we must ensure auction amounts don’t exceed monthly accruals. This approach allows reserves to grow in these markets while still providing sufficient funds for reserve auctions. The following section details how reserves have grown during August 2025.
Reserve Accrual (8/1/25 - 9/1/25)
| Asset | Token Change | From Liquidations | Liquidation % | From Interest | Interest % | USD Change |
|---|---|---|---|---|---|---|
| USDC | 107383 | 59247.3 | 55.20% | 48135.6 | 44.80% | $107,383.00 |
| cbBTC | 0.561 | 0.501495 | 89.40% | 0.0595048 | 10.60% | $60,750.69 |
| AERO | 24485 | 6601.3 | 27.00% | 17883.7 | 73.00% | $28,084.30 |
| WETH | 4.9123 | 2.13518 | 43.50% | 2.77712 | 56.50% | $21,571.38 |
| weETH | 1.0581 | 0.960807 | 90.80% | 0.0972926 | 9.20% | $4,978.76 |
| cbXRP | 1063.93 | 853.099 | 80.20% | 210.828 | 19.80% | $2,952.41 |
| WELL | 80699.5 | 44541.1 | 55.20% | 36158.5 | 44.80% | $2,259.59 |
| VIRTUAL | 1290.89 | 193.246 | 15.00% | 1097.65 | 85.00% | $1,436.76 |
| wstETH | 0.2242 | 0.200034 | 89.20% | 0.0241663 | 10.80% | $1,190.95 |
| EURC | 706.834 | 73.0648 | 10.30% | 633.769 | 89.70% | $825.58 |
| MORPHO | 349.176 | 34.923 | 10.00% | 314.253 | 90.00% | $672.51 |
| cbETH | 0.1141 | 0.101825 | 89.20% | 0.0122746 | 10.80% | $550.52 |
| DAI | 338.247 | 0.10306 | 0.00% | 338.144 | 100.00% | $338.25 |
| LBTC | 0.001 | 1.72E-05 | 1.70% | 0.000982786 | 98.30% | $108.34 |
| tBTC | 0.0002 | 3.27E-05 | 16.40% | 0.000167298 | 83.60% | $21.65 |
| USDS | 20.1368 | 6.67925 | 33.20% | 13.4576 | 66.80% | $20.14 |
| rETH | 0.001 | 6.23E-05 | 6.20% | 0.000937727 | 93.80% | $5.00 |
| wrsETH | 0.0002 | 0.0002 | 100.00% | 0 | 0.00% | $0.92 |
| Total = $233,147.76 |
Reserve Auction
| Asset | Price | Current Reserves (Tokens) | Recommended Reserves (Tokens) | Recommended Reserves (USD) | Tokens to be auctioned | USD equivalent to be auctioned |
|---|---|---|---|---|---|---|
| WETH | $4,391.30 | 330.6067 | 320 | $1,405,215.36 | 0* | $0.00* |
| USDC | $1.00 | 471383.8327 | 430000 | $430,000.00 | 41383.8327 | $41,383.83 |
| CBBTC | $108,289.86 | 2.2165 | 3 | $324,869.57 | 0 | $0.00 |
| AERO | $1.15 | 145522.9171 | 130000 | $149,110.00 | 15522.9171 | $17,804.79 |
| EURC | $1.17 | 18655.787 | 84000 | $98,112.00 | 0 | $0.00 |
| CBETH | $4,824.93 | 9.7275 | 9 | $43,424.39 | 0.7275 | $3,510.14 |
| WSTETH | $5,312.00 | 6.9866 | 6.6 | $35,059.17 | 0.3866 | $2,053.62 |
| MORPHO | $1.93 | 2634.9028 | 18000 | $34,668.00 | 0 | $0.00 |
| WELL | $0.03 | 1397904.724 | 1200000 | $33,600.00 | 197904.7238 | $5,541.33 |
| WEETH | $4,705.38 | 7.7198 | 6 | $28,232.30 | 1.7198 | $8,092.32 |
| RETH | $5,001.41 | 2.53 | 4 | $20,005.64 | 0 | $0.00 |
| LBTC | $108,342.83 | 0.1636 | 0.228 | $24,702.17 | 0 | $0.00 |
| TBTC | $108,265.16 | 0.0183 | 0.216 | $23,385.28 | 0 | $0.00 |
| CBXRP | $2.78 | 2132.2173 | 6000 | $16,650.00 | 0 | $0.00 |
| VIRTUAL | $1.11 | 7779.7733 | 6000 | $6,678.00 | 1779.7733 | $1,980.89 |
| WRSETH | $4,609.96 | 0.7834 | 1 | $4,609.96 | 0 | $0.00 |
| USDS | $1.00 | 56.287 | 2760 | $2,760.00 | 0 | $0.00 |
| DAI | $1.00 | 932.4622 | 900 | $900.00 | 32.4622 | $32.46 |
| Total = $2,681,981.82 | Total = $80,399.37 |
*= issue with WETH Unwrapper contrcat currently prohibits WETH reserves from being auctioned off.
These minimum reserve recommendations will lead to approximately $80K in collateral to be auctioned off for WELL, which should in turn fund the safety staking module with an additional ~3.5% APY.
Conclusion
The minimum reserve strategy presented here balances two critical objectives: maintaining sufficient reserves to absorb bad debt during market stress events while funding the safety staking module through strategic reserve auctions. Our analysis using the Anthias Liquip Score and Collateral-at-Risk metrics reveals that WETH, USDC, EURC, and cbBTC face the highest exposure to bad debt accumulation, as these assets are predominantly borrowed against higher-risk collateral. Moving forward, we plan to regularly update this framework as market conditions evolve.